


Our Expertise in Data Visualization Services
Modern enterprises operate vast amounts of business data. No matter how complete, these complex datasets are worth nothing unless you subject them to end-to-end analytics and present the results in an easy-to-understand format. If you are looking for it, we are here to help.
Livepage is a leading expert in data analytics and visualization services, delivering diverse solutions in this niche for 14+ years. Over the past decade and a half of our presence in the market, our vetted professionals have accumulated a vast body of theoretical knowledge and practical skills, enabling us to help over 400 projects across multiple verticals.
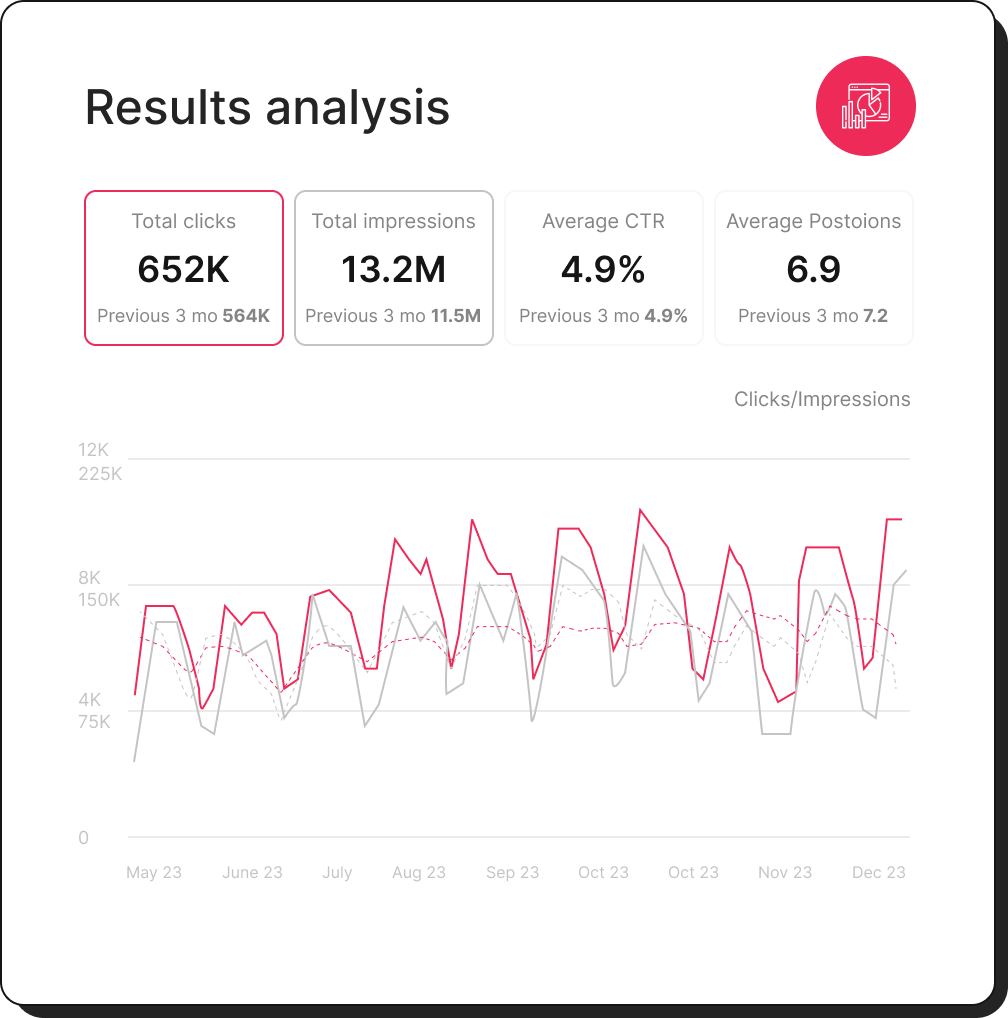
Moreover, we practice what we preach. When communicating all milestone information for the ongoing project, we deliver data updates to our clients through straightforward, comprehensible dashboards that dynamically display key metrics and parameters, so that they can track project progress. Thus, by enlisting the marketing data visualization services of Livepage’s professionals, our clients get a foretaste of what they will enjoy for years to come.
How Can Our Data Visualization Services Help Your Business?
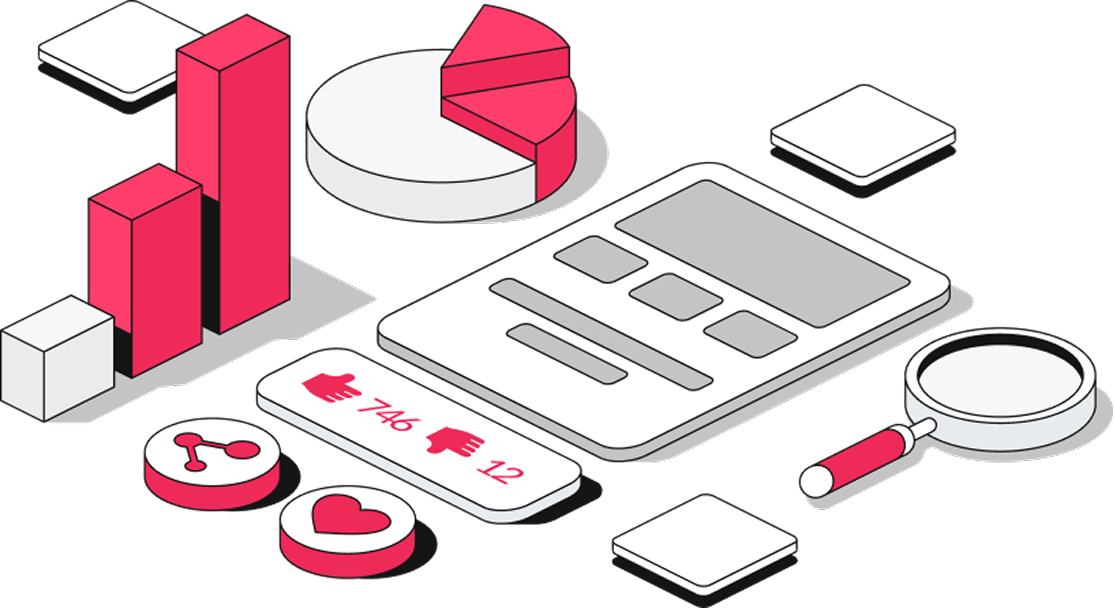
Leveraging our solutions, both C-suite managers and rank-and-file employees can track the main KPIs of their website (e.g., conversions, MQL, SQL, etc.), obtain insights into traffic channels and website pages that bring quality leads, access cloud analytics, monitor brand development in traffic reports, and stay abreast of other vital metrics. The software we craft includes interactive dashboards, infographics, charts, tables, geospatial data visualizations, and other data representation techniques that enable users to gain a 360-degree view of the data they process, uncover trends, identify loopholes, and reveal hidden growth opportunities.
If you need a data visualization service for a business of any kind, including SaaS marketing analytics, B2B performance indices, analytics for a local business, and more, we have you covered.
Why Choose Livepage for Data Visualization Service
By opting for Livepage as a high-profile provider of data visualization and marketing analytics services, you are entitled to:

Broad industry competency

A clear vision of your business objectives

State-of-the-art tech stack

Flexible cooperation approach
We are recognized by reliable niche platforms and rankings
Check out the awards we value the most.


Peculiarities of Livepage Data Visualization Services Approach

Expert Dashboards

Data from multiple sources

Share access

Customize to your needs
We work with


Here are our results
Check out the strategies we choose for our clients and the results they bring. Read the case study.


We do our best to boost the growth of our clients, and that’s what they have to say about our approach and results
See our reviews.

“Livepage has proven to be a reliable source for rapid online growth. We started with 2,000 visitors per month. In 3 years together with Livepage we have reached 70,000 visitors and more than 100 leads from the site per month.”


“As for the results, we’ve been working together since 2015, and our traffic has increased 10x. I cannot say that Livepage was our first SEO company, but they have become the first SEO partner that helped us to achieve the success we were looking for.”


“I am pleased with the quick task execution and the instant replies to my messages.”


“I like the complex approach that the Livepage team offers. Absolutely all team members work together; everyone is aware of what is happening on the project. We have one common goal – to increase our service sales, and the team is making every effort to achieve the goal as soon as possible.”


“We were pleasantly surprised by the robust of the team.”


“We were most impressed by their team’s competence — every step was planned ahead.”

FAQ
What should a paid media dashboard include?
Data visualization for marketers should include:
- Cards of the main metrics and deviations from the previous period:
- Traffic;
- Conversions, MQL, SQL;
- Conversion cost (all or only high-quality ones);
- Engagement metrics;
- ROMI.
- Graphs showing the main metrics dynamically, with the option to select additional metrics as needed.
- Tabular presentation of data based on one main parameter.
How do you create a digital marketing dashboard?
As part of data visualization as a service, we create digital marketing dashboards in 5 stages:
- Setting up key performance indicators and metrics.
- Defining the end user.
- Determining which data sources you need for visualization.
- Data processing as required.
- Creating a Google Analytics data visualization.
What makes a good digital marketing reporting dashboard?
A good digital marketing reporting dashboard is clear, goal-driven, and easy to scan, with the right KPIs, clean visuals, and actionable insights. It can be built from a well-defined tracking and visualization brief (e.g., for Google Analytics).
What are the benefits of data visualization?
The most valuable data visualization advantages include:
- Faster understanding of visualized data in comparison to text-heavy reports.
- Better engagement thanks to visual means that hold users’ attention longer.
- Clearer insights, patterns, and trends that traditional reports can miss.
- Support for predictive analysis and forecasting.
- Higher productivity and better decision-making, which can translate into greater revenue.
What are the different types of data visualization?
They are usually classified by what they’re meant to show:
- Temporal models (Gantt, line, steamgraph) contain time-based data.
- Hierarchical models (treemap, dendrogram) showcase structures.
- Network models (chord diagrams) display relationships.
- Geospatial models (maps, dot maps) visualize location-based data.
- Multidimensional models (scatter plot, bubble) expose multiple variables.
Besides, some chart types used in data visualization can be employed to represent various kinds of statistics (stock price fluctuations, market shares, age distributions, and more), while others have a narrow focus (e.g., showing stages of a process, such as a sales pipeline).
Our Other Services & Solutions
Get sales and marketing analytics services from a team with 14 years of experience.


Alina will get back to you
within 24 hours🐢
Reach out to Livepage
Contact us to clarify essential points and learn more about our services👋