


16 min reading
Local Landing Pages for Better Local SEO
In analytics, pages are often judged by pageviews. But a view doesn’t equal value. What matters is which pages actually move a user closer to a form submission or a purchase?
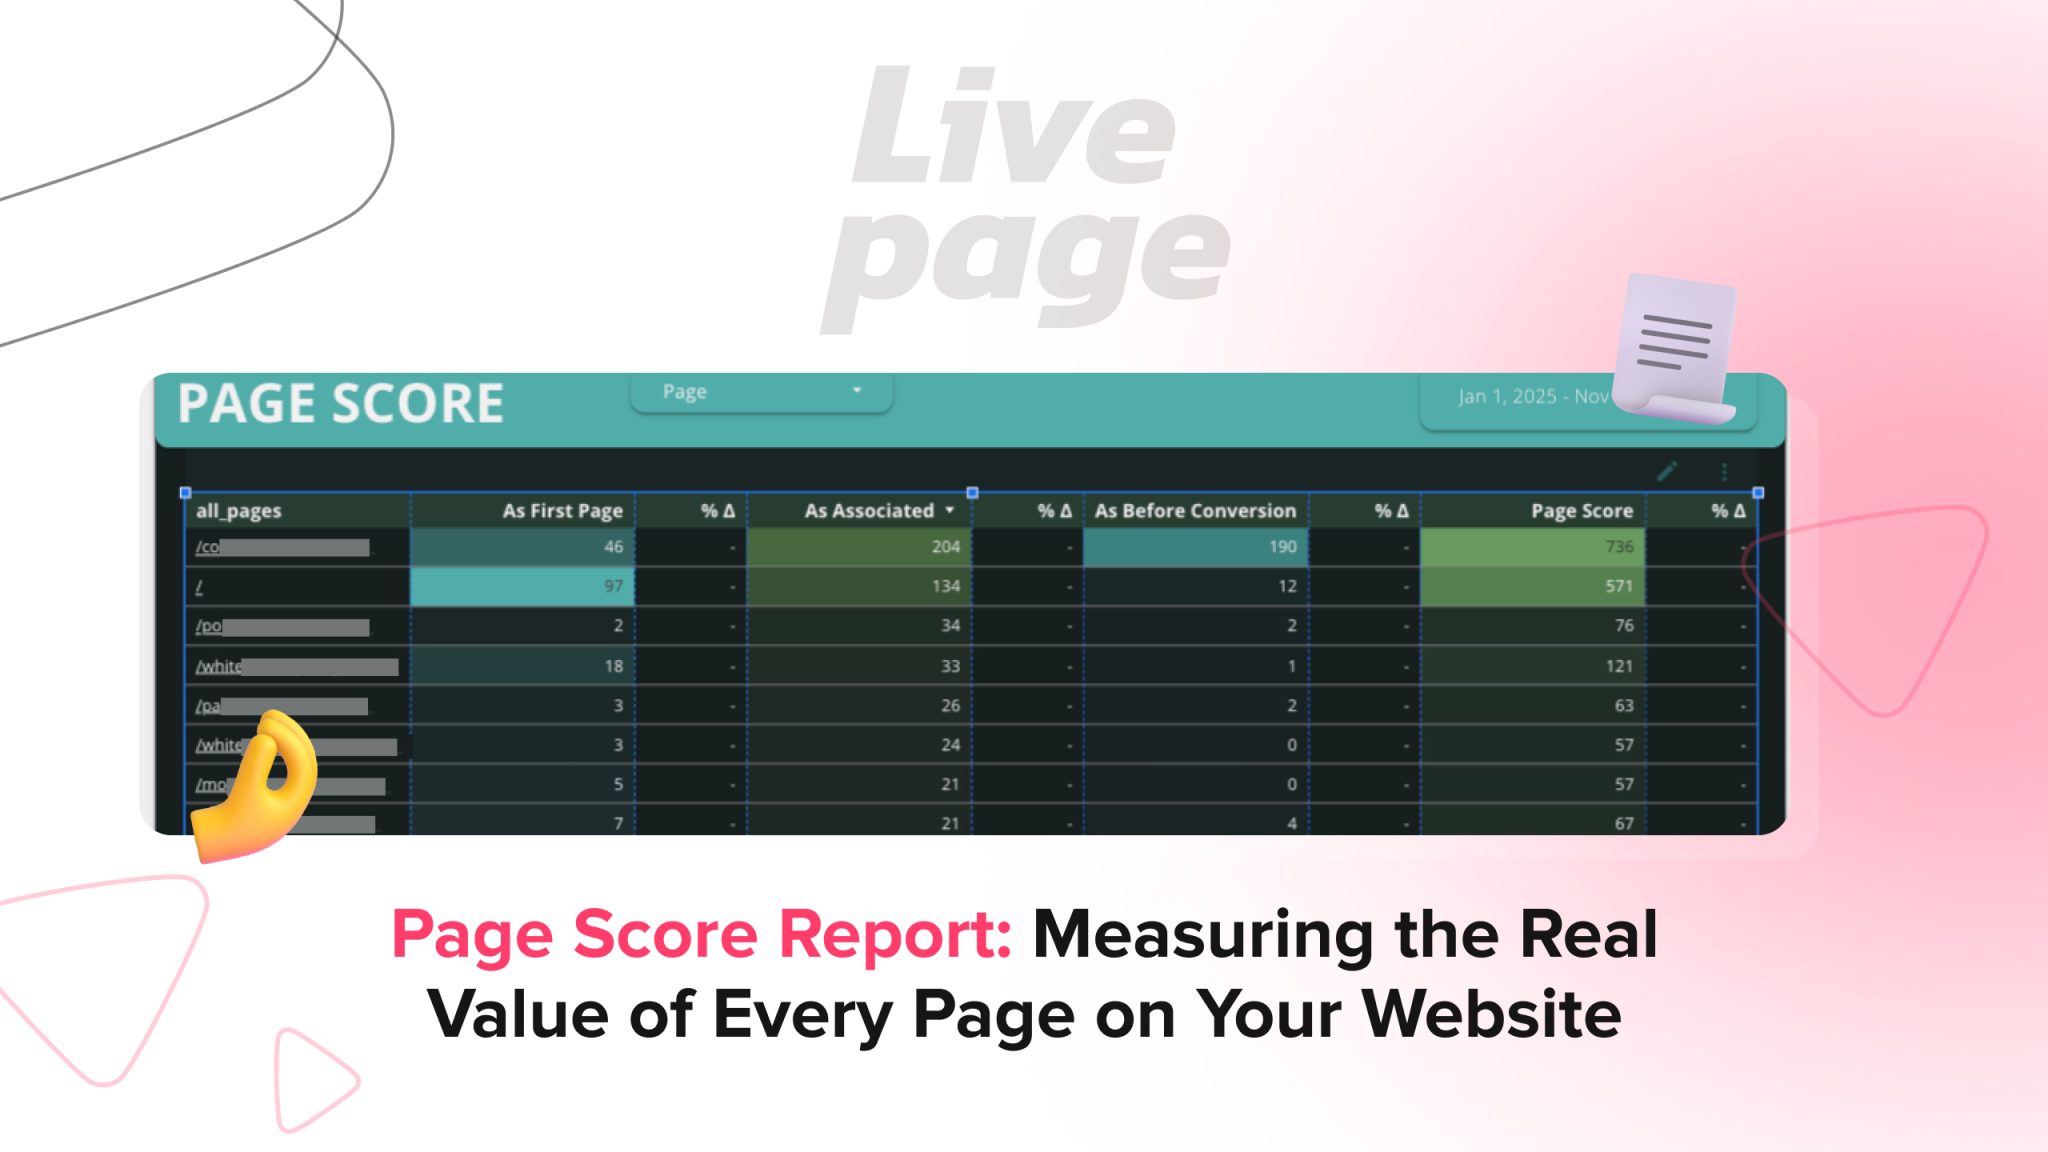
That’s why we created the Page Score Report — an analysis that shows the role each page plays across lead journeys and how much it truly contributes to conversions.
Each website page gets its own Page Score — a consolidated metric that shows its real impact on conversions. The score is calculated using our proprietary scoring model, which accounts for the role a page plays at different stages of the user journey:
By combining these factors, we can see not just page traffic, but each page’s true contribution to business results.
An experienced on-page SEO expert can use Page Score data to improve high-impact pages while strengthening weaker parts of the conversion journey.
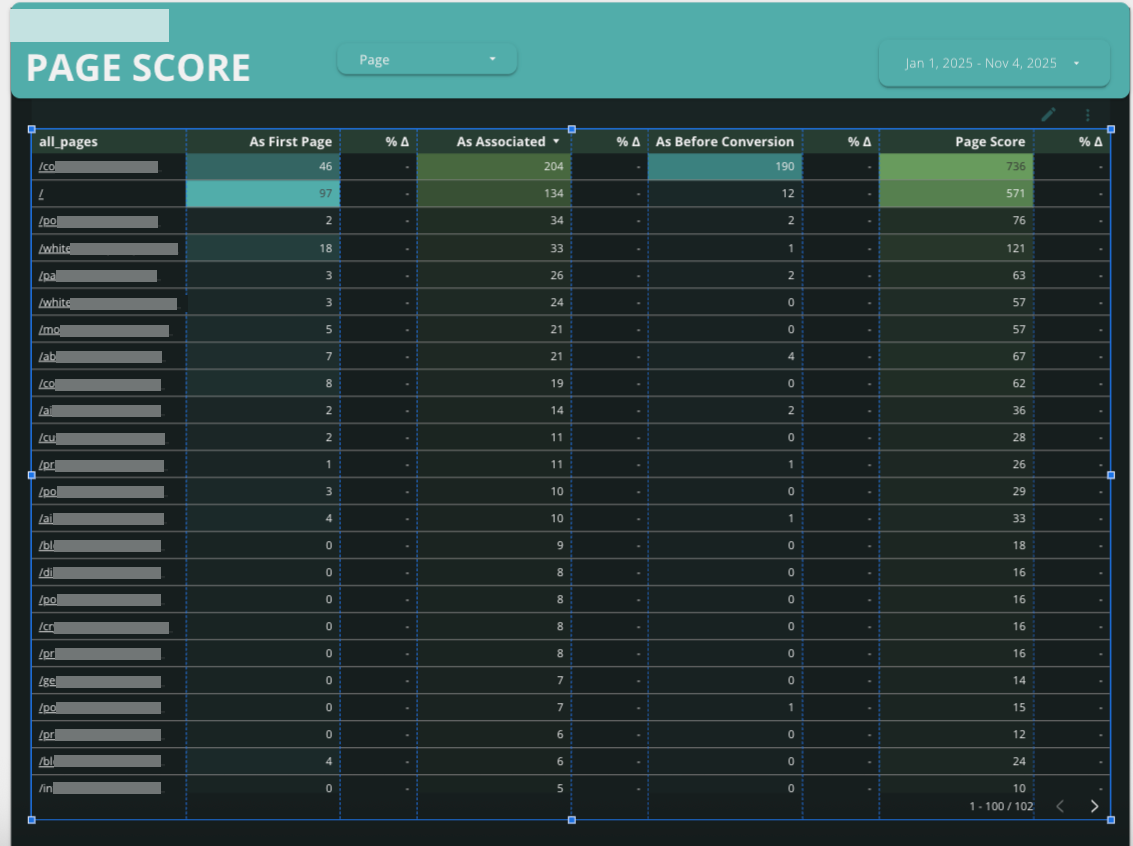
Using one of our client websites as an example, you can clearly see how different pages play different roles across the funnel:
In other words, the report helps you pinpoint the pages that truly drive business results, not just traffic.
Accurate target audience and SEO research makes Page Score insights even more valuable by showing whether high-scoring pages truly match user intent.
Comparing a landing page vs blog post is useful when interpreting Page Score results, since each page type supports different stages of the customer journey.
Many businesses include Page Score analysis as part of broader website SEO audit services to prioritize optimization efforts.
This report is like an X-ray for your website. It reveals where the most valuable user interactions actually happen. Instead of guessing why some pages “work” and others don’t, you can see it clearly in the numbers.
You can also explore our comprehensive crawlability audit for Class Central to see how crawlability improvements support stronger website performance alongside conversion-focused reporting.


“Livepage has proven to be a reliable source for rapid online growth. We started with 2,000 visitors per month. In 3 years together with Livepage we have reached 70,000 visitors and more than 100 leads from the site per month.”


“As for the results, we’ve been working together since 2015, and our traffic has increased 10x. I cannot say that Livepage was our first SEO company, but they have become the first SEO partner that helped us to achieve the success we were looking for.”

“Livepage delivers SEO efforts that have led to an increase in the site’s users, traffic, and conversions. The team uses a wide range of tools to achieve the client’s goals. They are attentive to the client’s needs, working with them in real-time and bringing in additional specialists when needed.”


“I am pleased with the quick task execution and the instant replies to my messages.”


“I like the complex approach that the Livepage team offers. Absolutely all team members work together; everyone is aware of what is happening on the project. We have one common goal – to increase our service sales, and the team is making every effort to achieve the goal as soon as possible.”

“We’ve been really impressed by how Livepage quickly understood our business and centred our PPC campaign around our objectives. We have achieved good results within a very short time in both revenue and ROI.”


“Everything is clear, timely, and understandable.”


“They have leveraged ideal opportunities to reach our business goals.”