


1 min reading
Review from the Topdog company about collaboration with Livepage

If you’re in eCommerce, you’ve probably asked yourself this more than once: is it better to invest in acquiring new customers or focus on retaining the ones you already have? One of the most useful tools to help you make smart business decisions is cohort analysis. It lets you track what people do after their first interaction with your brand and shows how effective your marketing efforts really are.
How to conduct cohort analysis? Let’s take a closer look at what cohort analysis actually is, how it works in marketing, and how it helps you better understand user behavior.
Cohort analysis is a type of behavioral analytics that groups users (cohorts) based on shared characteristics or experiences within a specific timeframe. Simply put, it lets you track how different groups of customers behave — for example, based on the month they signed up — and monitor how many return after 1, 2, or 3 months.
Why do you need cohort analysis? It helps you evaluate marketing effectiveness and pinpoint when users stop engaging. This kind of data shows how different user groups perform over time.
What kind of data does cohort analysis include? Typically: sign-up or first purchase dates, retention stats, traffic sources, and behavioral patterns.
You don’t have to be in eCommerce to use it. For example, in the HoReCa industry, a coffee shop owner might group customers by the month of their first visit, then analyze how many returned — and what influenced their decision: a holiday promo, discount, or special offer.
Want to go deeper into advanced analytics? Check out our post: “What Is End-To-End Analytics and Why Is It Important for Business”.
1. When and why do users drop off?
One of a marketer’s key goals is to retain customers. Customer cohort analysis helps identify exactly when people lose interest — whether that’s a few days after signing up or after their first purchase. For example, if users typically drop off around day 7 without contact, that’s your signal to send a timely offer.
2. Which marketing campaign delivers better results?
Basic analytics might tell you how many conversions you got. But cohort analysis takes it further. It reveals which user groups made more repeat purchases or which traffic sources brought in loyal customers.
3. How do updates or redesigns affect user engagement?
Launched a new version of your app or site? Use cohort analysis to compare retention before and after the update and see if engagement improved.
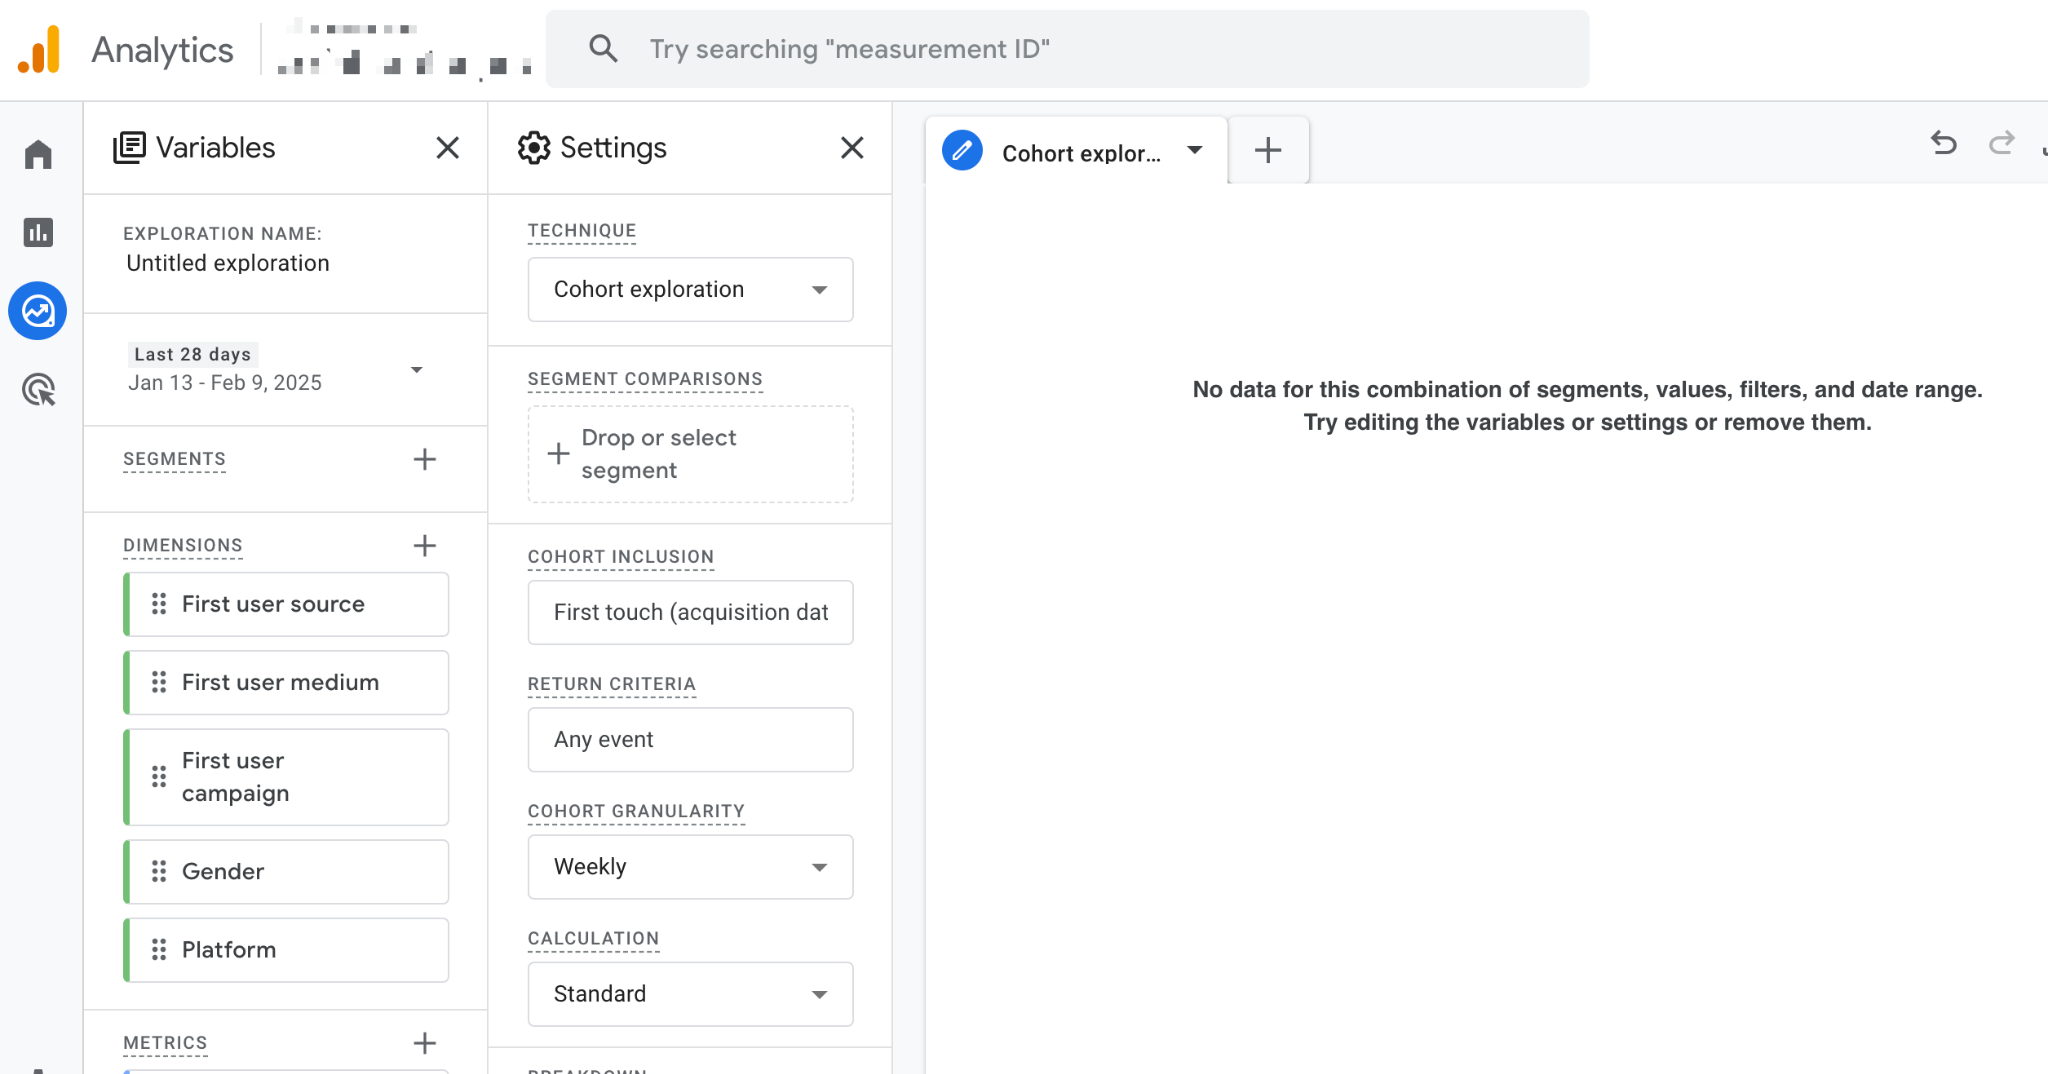
One of the easiest ways to get started with cohort analysis is through Google Analytics 4 (GA4), which has a built-in feature that allows you to create cohorts based on when users first visited your site or made a purchase.
| How to find | In GA4, go to the “Explorations” tab → “Cohort Analysis”. |
| Limitations | You can only create a basic cohort analysis chart, such as grouping users by the time of their first visit. Additionally, GA4 primarily tracks behavior at the device level, so it might not show the full picture if a user switches between devices. |
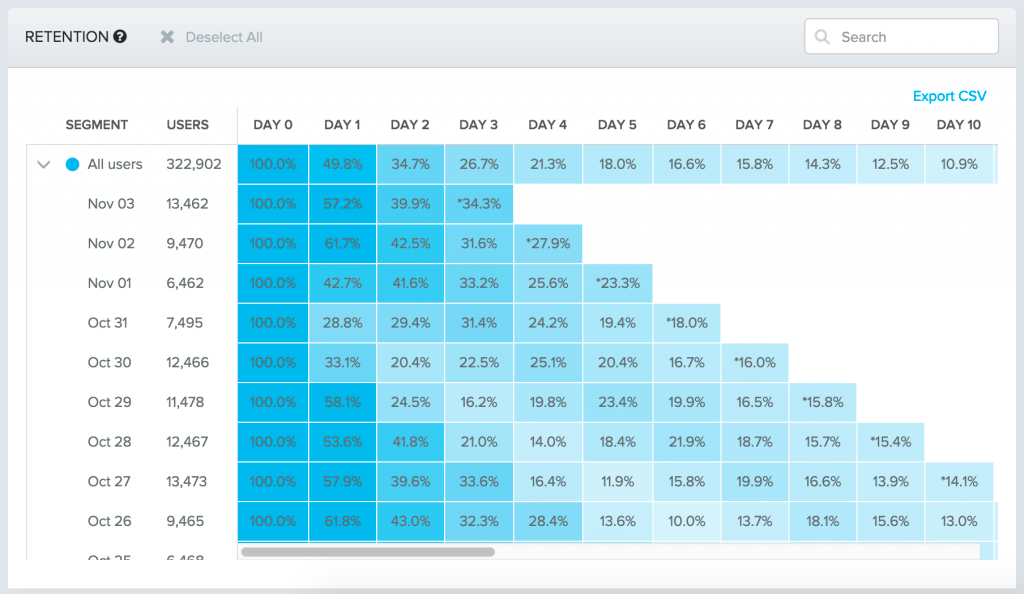
| What do you get with GA4 cohort analysis? | You can see how many users from a specific cohort return in later periods (weeks, months, etc.). However, you can’t fully customize cohorts with more advanced filters, such as grouping by traffic source and product category simultaneously. It provides a general sense of how user activity changes over time. |
Useful link: Detailed guide from Google on how to interpret cohort analysis in GA4.
If you are looking for something more flexible than what GA4 offers, check out BigQuery with raw data access. You will be able to group users not just by time but also by traffic source, product categories, or behavior-based criteria. You will need to carefully plan your data structure and queries to avoid drawing incorrect conclusions.
If you are looking for a comprehensive solution to bring solid analytics into your business, check out our end-to-end analytics setup service. We will help you build a complete data pipeline, from Google Ads to your CRM.
Cohort analysis is a great way to track how customers behave after their first purchase. For example, you can see the percentage of users who return to the site within the next 30 days.
It also helps you identify which products are catching the eye of different cohorts and whether there’s potential for cross-sells.
Cohort analysis for SaaS businesses should include key data like account activation, feature usage, and when users switch to a paid plan.
If you’re wondering about the cohort analysis meaning, the answer is simple — it helps you see which features work best for user retention.
If you’re looking to go beyond basic reporting, BigQuery is a powerful tool for running advanced behavioral cohorts. You can export data from GA4, Facebook Ads, or your CRM directly into BigQuery.
Here’s what you can do:
Example BigQuery SQL Snippet:
WITH first_touch AS (


  -- We define the first interaction date for each user


  SELECT


    user_pseudo_id,


    MIN(PARSE_DATE('%Y%m%d', event_date)) AS first_touch_date


  FROM `your_project_id.analytics_XXXXXX.events_*`


  WHERE event_name = 'session_start'  -- Or another "first touch" event


  GROUP BY user_pseudo_id


),


cohort_analysis AS (


  -- We match the first visit date with every follow-up action


  SELECT


    ft.user_pseudo_id,


    ft.first_touch_date,


    PARSE_DATE('%Y%m%d', e.event_date) AS event_date,


    DATE_DIFF(PARSE_DATE('%Y%m%d', e.event_date), ft.first_touch_date, MONTH) AS month_number


  FROM `your_project_id.analytics_XXXXXX.events_*` e


  JOIN first_touch ft


  ON e.user_pseudo_id = ft.user_pseudo_id


)


-- We count retained users in each cohort by month


SELECT


  first_touch_date,


  month_number,


  COUNT(DISTINCT user_pseudo_id) AS retained_users


FROM cohort_analysis


WHERE month_number BETWEEN 0 AND 6  -- We track retention for the first 6 months


GROUP BY first_touch_date, month_number


ORDER BY first_touch_date, month_number;
Using similar SQL logic, you can track cohorts not just by user_id, but also by combining data from other ad platforms. You can simply upload those datasets to Google Cloud. Once everything is set up, you can visualize your reports in Looker Studio or Power BI.
Suitable for:
Note: Working with raw data in BigQuery requires a solid understanding of SQL and how GA4 or your ad platforms structure their data. If your cohort retention analysis is inaccurate, it can lead to misleading insights — and ultimately impact business decisions.
But don’t worry. At Livepage, we handle the heavy lifting, from processing raw data to building custom cohorts and transforming them into clear visual reports in Looker Studio, Power BI, or any tool you prefer. That way, you get real insights without dealing with complex queries and setups.
| Features | Both tools are built for behavioral analytics in mobile apps.You can build cohorts based on user actions, subscription type, or even how users move through your funnels. |
| How to process data | Smart filters let you track user behavior by time, events, or user type.You can also create personalized segments for ad targeting. |
| Suitable for | Mobile products and SaaS tools where it’s important to monitor user activity over time.Companies that want to see how user engagement shifts after an update or promo. |
If you need help with the Amplitude analytics setup, we’ll be happy to help.
| Where to build | Excel, Google Sheets |
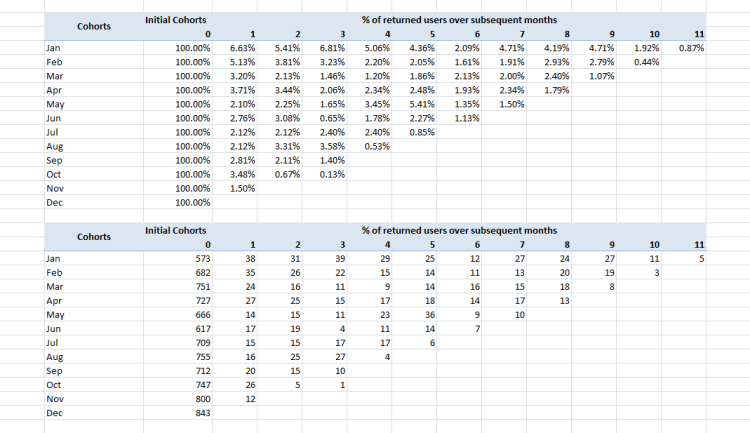
| How to process data | If you have data exports (for example, from your CRM or GA4), you can build a basic cohort table.Here’s how to conduct cohort analysis: rows = user acquisition dates, columns = activity periods (Month 1, Month 2, etc.).Then, you need to calculate retention rates for each cohort. |
| Suitable for | Small businesses that don’t have access to advanced analytics tools.Anyone who wants to test things out before moving to more complex systems. |
Here’s a quick breakdown to help you decide:
✅ Need a fast way to check user trends? → GA4
✅ Want deep insights using raw data? → BigQuery
✅ Analyzing a mobile app? → Amplitude / Mixpanel
✅ Looking to do a quick, simple analysis with no heavy platforms? → Google Sheets / Excel
At the end of the day, it all depends on your level of analytics and how deep you want to go with cohort analysis.
Cohort analysis is a powerful way to understand how your audience behaves over time. It helps you make smarter business decisions, accelerate growth, and improve customer retention. Reach out to the Livepage team if you need help with analytics.


“Livepage has proven to be a reliable source for rapid online growth. We started with 2,000 visitors per month. In 3 years together with Livepage we have reached 70,000 visitors and more than 100 leads from the site per month.”


“As for the results, we’ve been working together since 2015, and our traffic has increased 10x. I cannot say that Livepage was our first SEO company, but they have become the first SEO partner that helped us to achieve the success we were looking for.”

“Livepage delivers SEO efforts that have led to an increase in the site’s users, traffic, and conversions. The team uses a wide range of tools to achieve the client’s goals. They are attentive to the client’s needs, working with them in real-time and bringing in additional specialists when needed.”


“I am pleased with the quick task execution and the instant replies to my messages.”


“I like the complex approach that the Livepage team offers. Absolutely all team members work together; everyone is aware of what is happening on the project. We have one common goal – to increase our service sales, and the team is making every effort to achieve the goal as soon as possible.”


“We’ve been really impressed by how Livepage quickly understood our business and centred our PPC campaign around our objectives. We have achieved good results within a very short time in both revenue and ROI.”


“Everything is clear, timely, and understandable.”


“They have leveraged ideal opportunities to reach our business goals.”