


9 min reading
Why Your CRM and GA4 Show Different Conversions — and Which Data to Trust

In today’s digital marketing world, it’s hard to find anyone who hasn’t heard of Google Analytics 4. The platform has long been considered a best practice for online businesses, not only for its valuable insights and clean visualizations but also for the sheer volume of data it can collect.
Overall, Google Analytics 4 works well for understanding what’s happening on your website at a basic level. But what if you need deeper, more detailed analysis or want to connect this data with your CRM?
For example, a marketer might want to track how different traffic sources influence annual sales or uncover patterns between weather and purchases. That’s when things get tricky and where BigQuery becomes essential.
BigQuery is Google’s cloud data warehouse, designed specifically to handle massive amounts of information. Imagine a database capable of processing millions of rows in mere seconds. For users, it offers the ability to store raw data, create custom reports, and perform analyses at a much deeper level than standard analytics tools like GA4.
BigQuery operates using SQL-based queries, allowing data to be extracted and analyzed in a convenient, structured format. Its main advantages are speed and scalability. Even with enormous datasets, BigQuery processes information quickly without the need for physical servers or complex infrastructure. In other words, it’s the ideal solution for businesses that need not just access to data, but the ability to analyze it rapidly and accurately to make strategic decisions.
So, what’s the difference between GA4 and BigQuery, and why might BigQuery be the better choice for certain tasks? There are quite a few advantages. First and foremost is data retention. GA4’s standard interface stores data for a maximum of 14 months. But what if you want to track trends over a longer period? That’s where BigQuery comes in; it stores your data for as long as you need, with no limits.
In addition, BigQuery provides access to raw, unsampled data. It’s like seeing the full picture instead of a blurry snapshot: you get clear, precise numbers. When decisions depend on even the smallest details, BigQuery becomes an indispensable analytics tool.
But BigQuery’s capabilities go far beyond that. You can combine its data with other sources, such as CRM systems or email marketing platforms. Imagine noticing that customers buy more of a certain product when it rains. By combining weather data with BigQuery, you can build models and even predict the best timing for promotions. This isn’t just analysis, it’s intelligent forecasting that can help reduce costs and increase results.
Reporting platforms like Looker Studio often have API limitations, which can cause reports to “break” when data volumes exceed thresholds. With BigQuery, these restrictions don’t exist. Using SQL queries, you can create reports with exactly the dimensions and breakdowns you need. Today you might look at average order value, and tomorrow you could analyze which products are commonly bought together and during which seasons, insights GA4 alone cannot provide.
BigQuery also simplifies auditing your analytics. With near real-time access to data, you can quickly verify everything is working correctly and make adjustments if necessary. GA4 can delay data by a day, whereas BigQuery lets you see it immediately, crucial for fast market responses.
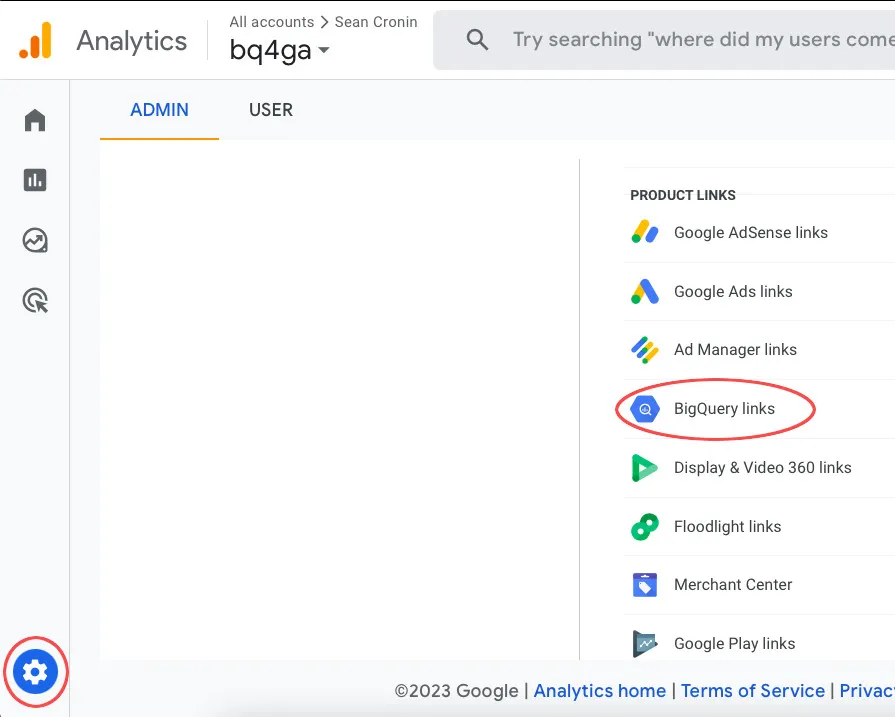
Curious? Let’s look at how these two tools can be connected.
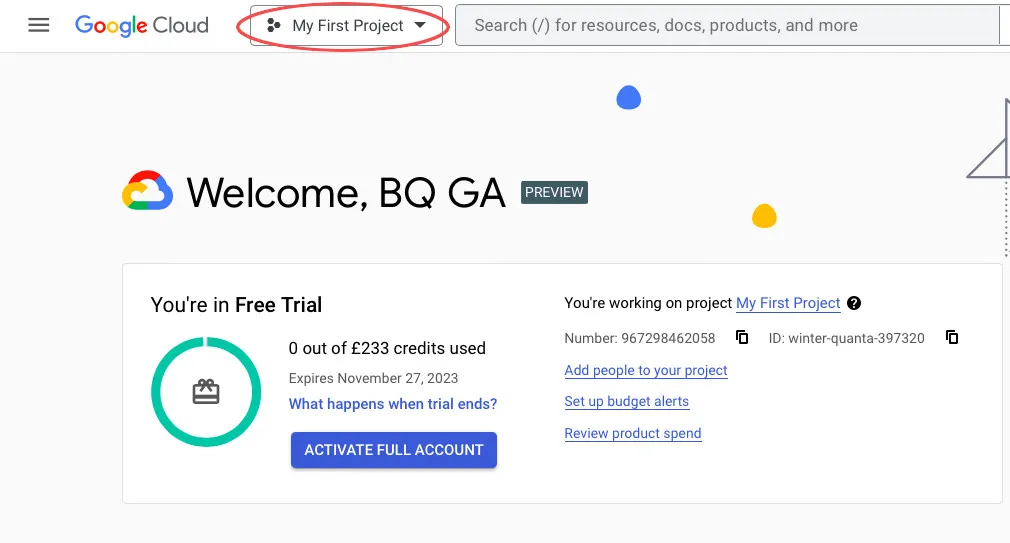
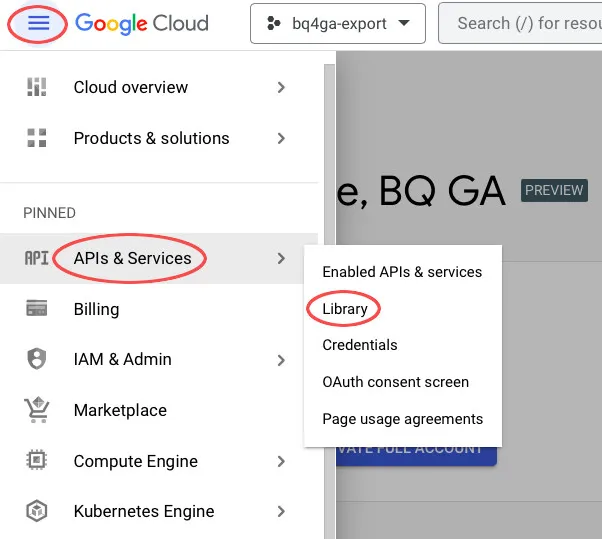
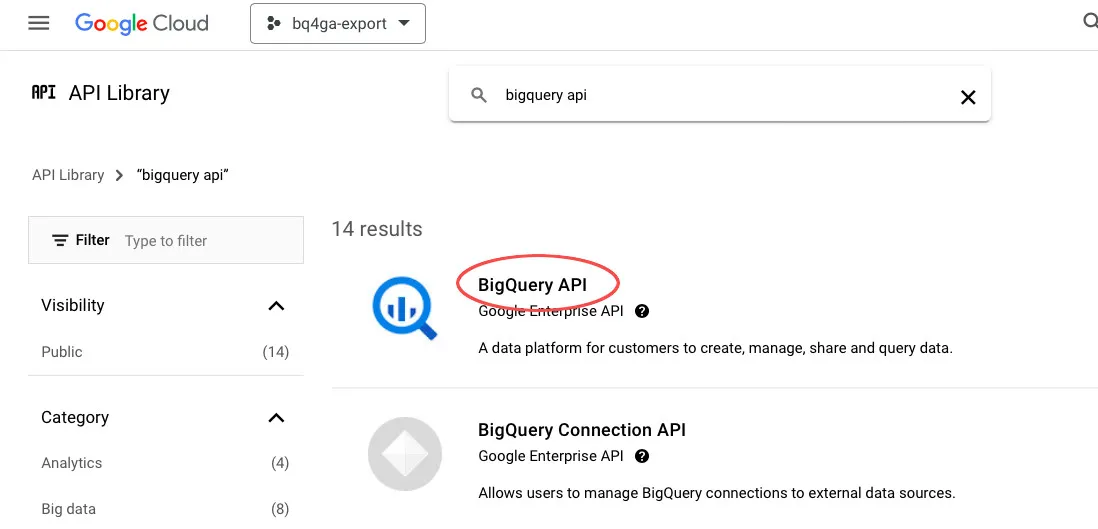
Before linking BigQuery with Google Analytics, you need to prepare your project in Google Cloud.
If you haven’t done this yet, sign up for a Google Cloud account. New accounts receive a 90-day free trial and $300 in credits to use on the platform. After the trial ends, you’ll still have free access to 10 GB of BigQuery storage and 1 TB of queries per month, usually enough for small websites or apps.
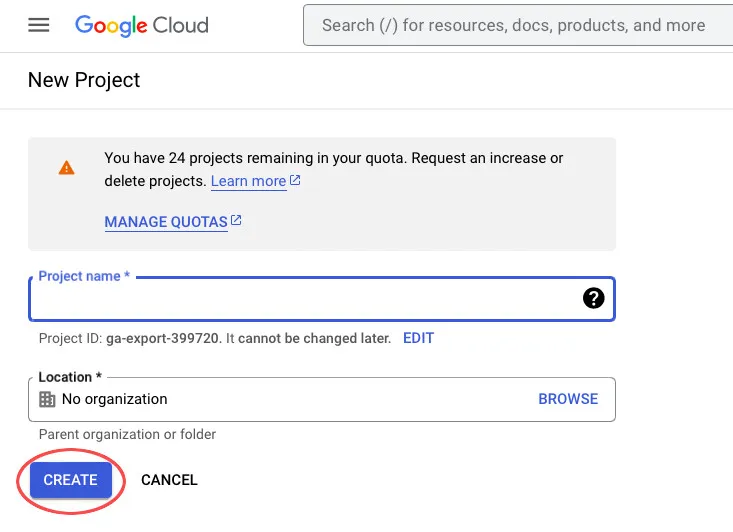
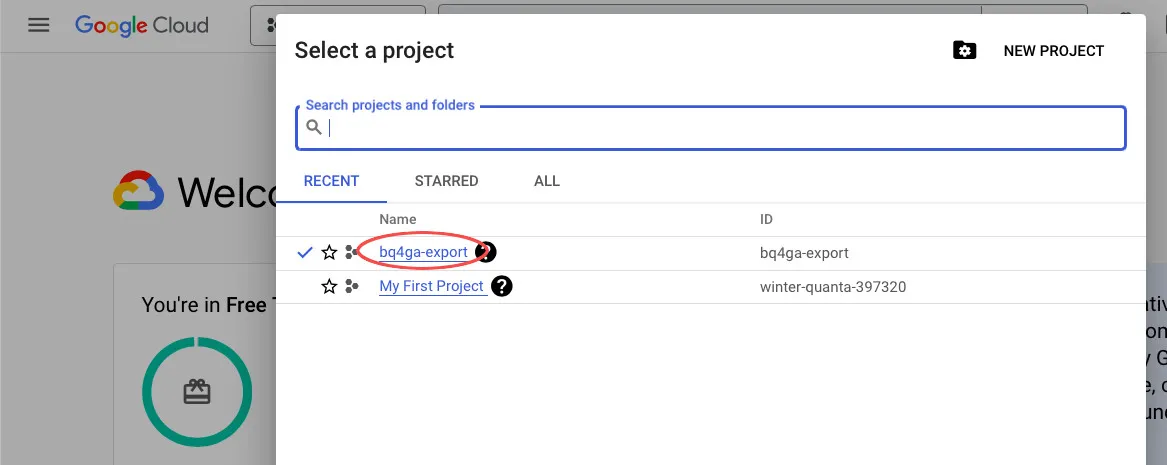
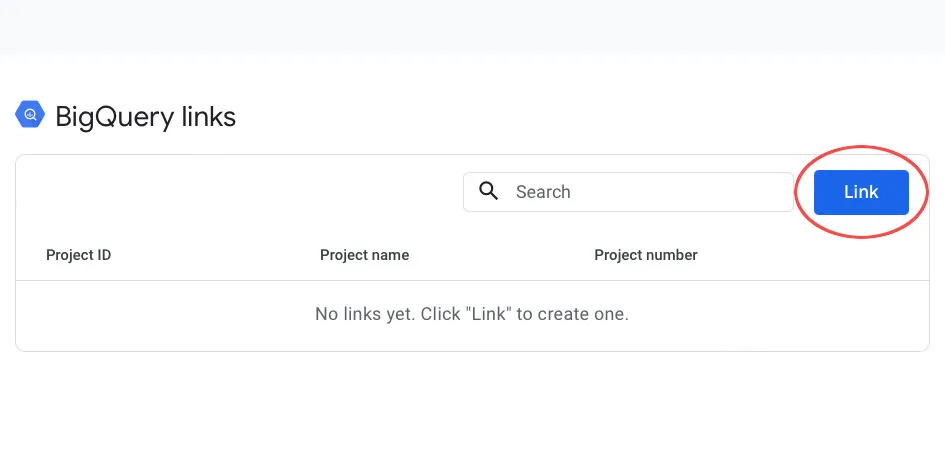
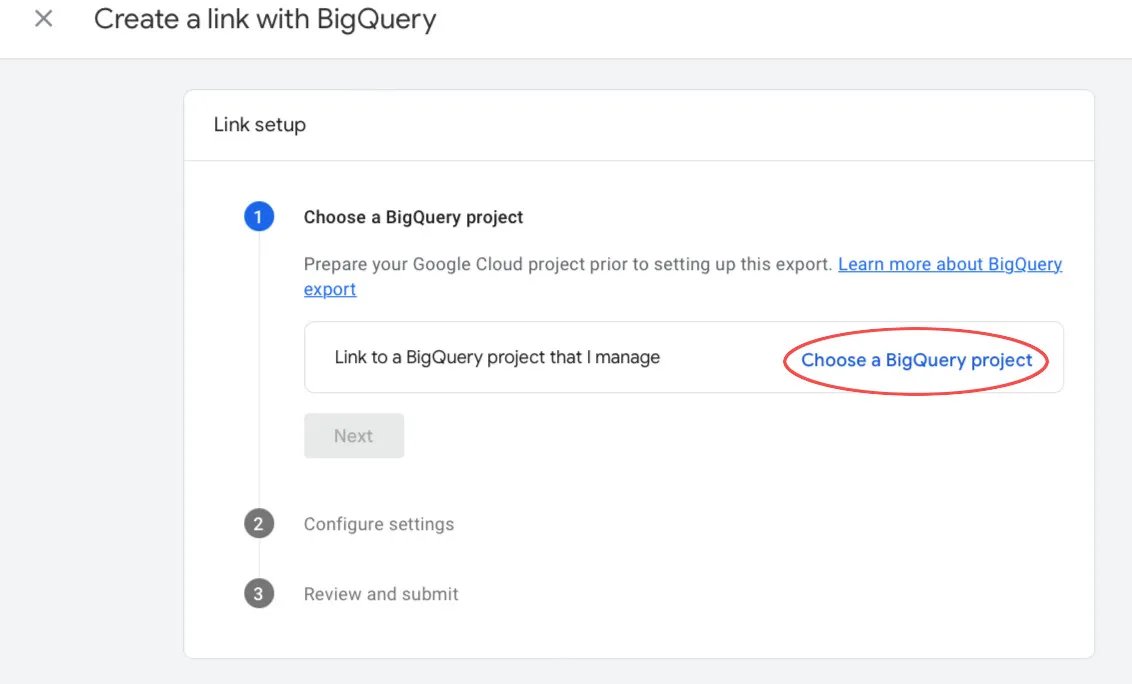
Project setup steps:
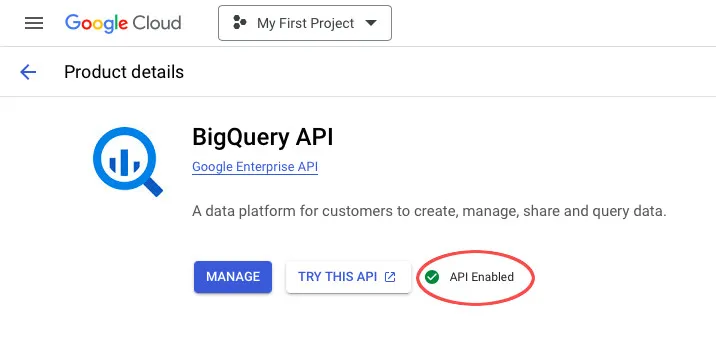
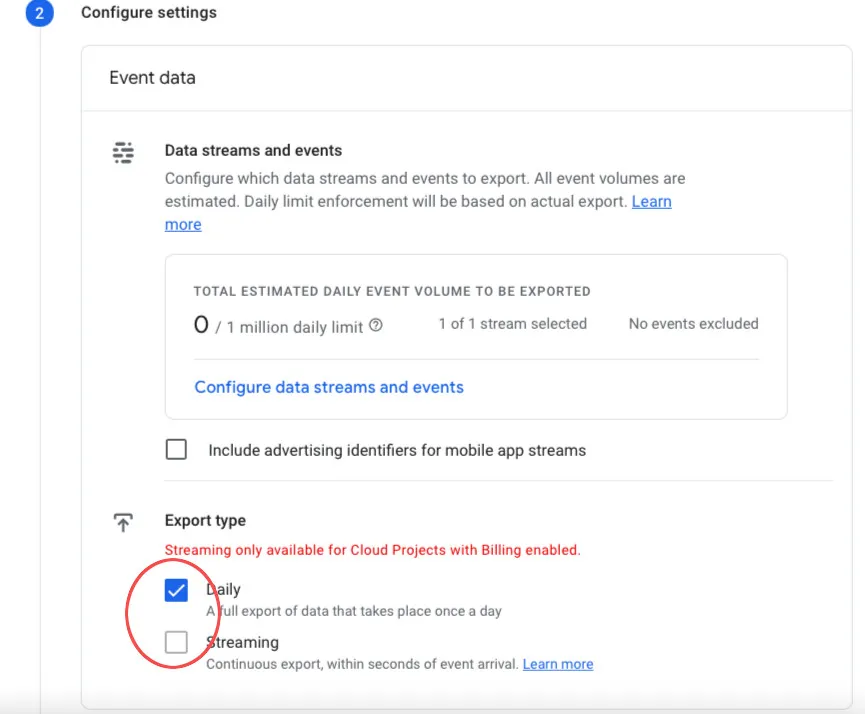
Note: You must enable billing in GCP to use streaming export.
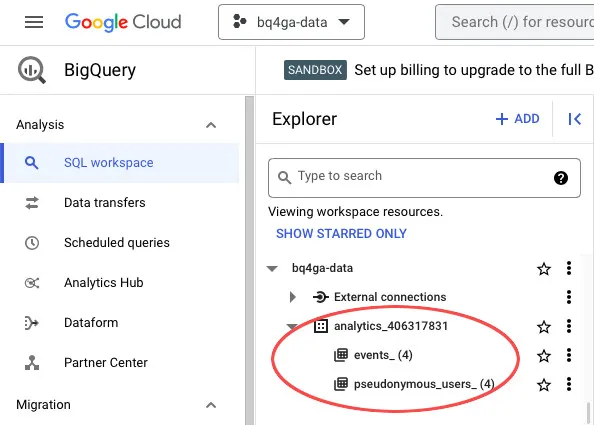
It may take up to 24 hours for data to appear, but soon you’ll see a new dataset in your BigQuery project, containing one or more tables depending on the type of export you enabled.
Once BigQuery is connected to GA4, you can start creating your first query and enjoy unrestricted access to your data!
At first, SQL may seem complex or intimidating, especially if you’re used to Google Analytics’ visual interface. However, the effort is well worth it. With BigQuery, data can be easily exported to spreadsheets and analyzed using familiar tools like Google Sheets or Excel, or connected to BI platforms such as Looker Studio or Tableau. With a little practice, you’ll quickly become comfortable with basic queries and you might even enjoy building your own custom analytics reports.
Not convinced? Real examples quickly show that BigQuery lets you access detailed analytics that aren’t available in the standard GA4 interface. This approach allows you to create custom reports with deep insights into user behavior, event tracking, product popularity, and many other aspects.
This query shows the number of unique events by date and event type (for example, page views, session starts, or purchases) over a specified time period. Event-level analytics in GA4 via BigQuery tracks changes in user activity, making it critical for evaluating the success of marketing initiatives.
SELECT


  event_date,


  event_name,


  COUNT(*) AS event_count


FROM


  `ваш_проект.ваша_база_danих.events_*`


WHERE


  event_name IN (’page_view’, ’session_start’, ’purchase’)


  AND _TABLE_SUFFIX BETWEEN ’20240101’ AND ’20240131’


GROUP BY 1, 2;
To effectively attract new customers, it’s important to know how many are visiting your site for the first time. This query calculates the total number of users as well as the number of new visitors based on first-visit or first-open events. You can use it to analyze in detail how your marketing campaigns are driving new user acquisition.
WITH


  UserInfo AS (


    SELECT


      user_pseudo_id,


      MAX(IF(event_name IN (’first_visit’, ’first_open’), 1, 0)) AS is_new_user


    FROM `ваш_проект.ваша_база_danих.events_*`


    WHERE _TABLE_SUFFIX BETWEEN ’20240101’ AND ’20240131’


    GROUP BY 1


  )


SELECT


  COUNT(*) AS user_count,


  SUM(is_new_user) AS new_user_count


FROM UserInfo;
This query helps optimize product pages and recommendations by showing the 10 most popular products that are added to carts most often, along with the number of users who performed each action.
SELECT


  item_id,


  item_name,


  COUNT(DISTINCT user_pseudo_id) AS user_count


FROM


  `ваш_проект.ваша_база_danих.events_*`, UNNEST(items)


WHERE


  _TABLE_SUFFIX BETWEEN ’20240101’ AND ’20240131’


AND event_name = ’add_to_cart’


GROUP BY


  1, 2


ORDER BY


  user_count DESC


LIMIT 10;
Note: BigQuery Data May Differ from Google Analytics Interface.
Don’t be surprised if you notice differences in metric values between BigQuery and the Google Analytics interface — this is intentional. BigQuery provides raw data, while GA4 applies several adjustments:
For practice and learning SQL, you can use tools that help generate queries without writing every detail manually. One such resource is GA4 SQL Generator, which allows you to quickly create BigQuery queries even if you’re new to SQL. It’s an excellent way to gradually become familiar with SQL queries and understand how reports are built in BigQuery.
Integrating BigQuery with GA4 opens up new opportunities for businesses to perform deeper analysis and make strategic decisions. With unlimited data storage, custom SQL queries, integration with other data sources, and detailed analytics, BigQuery becomes a powerful tool for those looking to get more from Google Analytics and take their analytics to the next level.
If you want to set up BigQuery for Google Analytics 4 quickly and efficiently, consider reaching out to Livepage. We can assist with connection, configuration, and report building or even end-to-end analytics, so you can focus entirely on decision-making rather than the technical aspects of the process.


“Livepage has proven to be a reliable source for rapid online growth. We started with 2,000 visitors per month. In 3 years together with Livepage we have reached 70,000 visitors and more than 100 leads from the site per month.”


“As for the results, we’ve been working together since 2015, and our traffic has increased 10x. I cannot say that Livepage was our first SEO company, but they have become the first SEO partner that helped us to achieve the success we were looking for.”

“Livepage delivers SEO efforts that have led to an increase in the site’s users, traffic, and conversions. The team uses a wide range of tools to achieve the client’s goals. They are attentive to the client’s needs, working with them in real-time and bringing in additional specialists when needed.”


“I am pleased with the quick task execution and the instant replies to my messages.”


“I like the complex approach that the Livepage team offers. Absolutely all team members work together; everyone is aware of what is happening on the project. We have one common goal – to increase our service sales, and the team is making every effort to achieve the goal as soon as possible.”


“We’ve been really impressed by how Livepage quickly understood our business and centred our PPC campaign around our objectives. We have achieved good results within a very short time in both revenue and ROI.”


“Everything is clear, timely, and understandable.”


“They have leveraged ideal opportunities to reach our business goals.”