


16 min reading
Local Landing Pages for Better Local SEO

When evaluating email campaigns, most marketers instinctively look at the open rate first. But the real lever for growth lies in a comprehensive set of email marketing metrics, because without deep analysis, you’re flying blind. Considering that email marketing generates an average of $36 for every $1 spent (according to Litmus research), mastering these indicators is the fastest path to scaling revenue.
In this material, we go beyond vanity metrics. You’ll learn about 10 key metrics for email marketing that directly impact conversions — from deliverability to revenue attribution.
Tracking email marketing success metrics isn’t just about counting opens. It’s about diagnosing the health of your sales funnel. Without this data, you can’t distinguish a poor subject line from an irrelevant offer. Thus, metrics serve as a roadmap for conversion optimization.
Different email marketing engagement metrics diagnose different funnel stages:
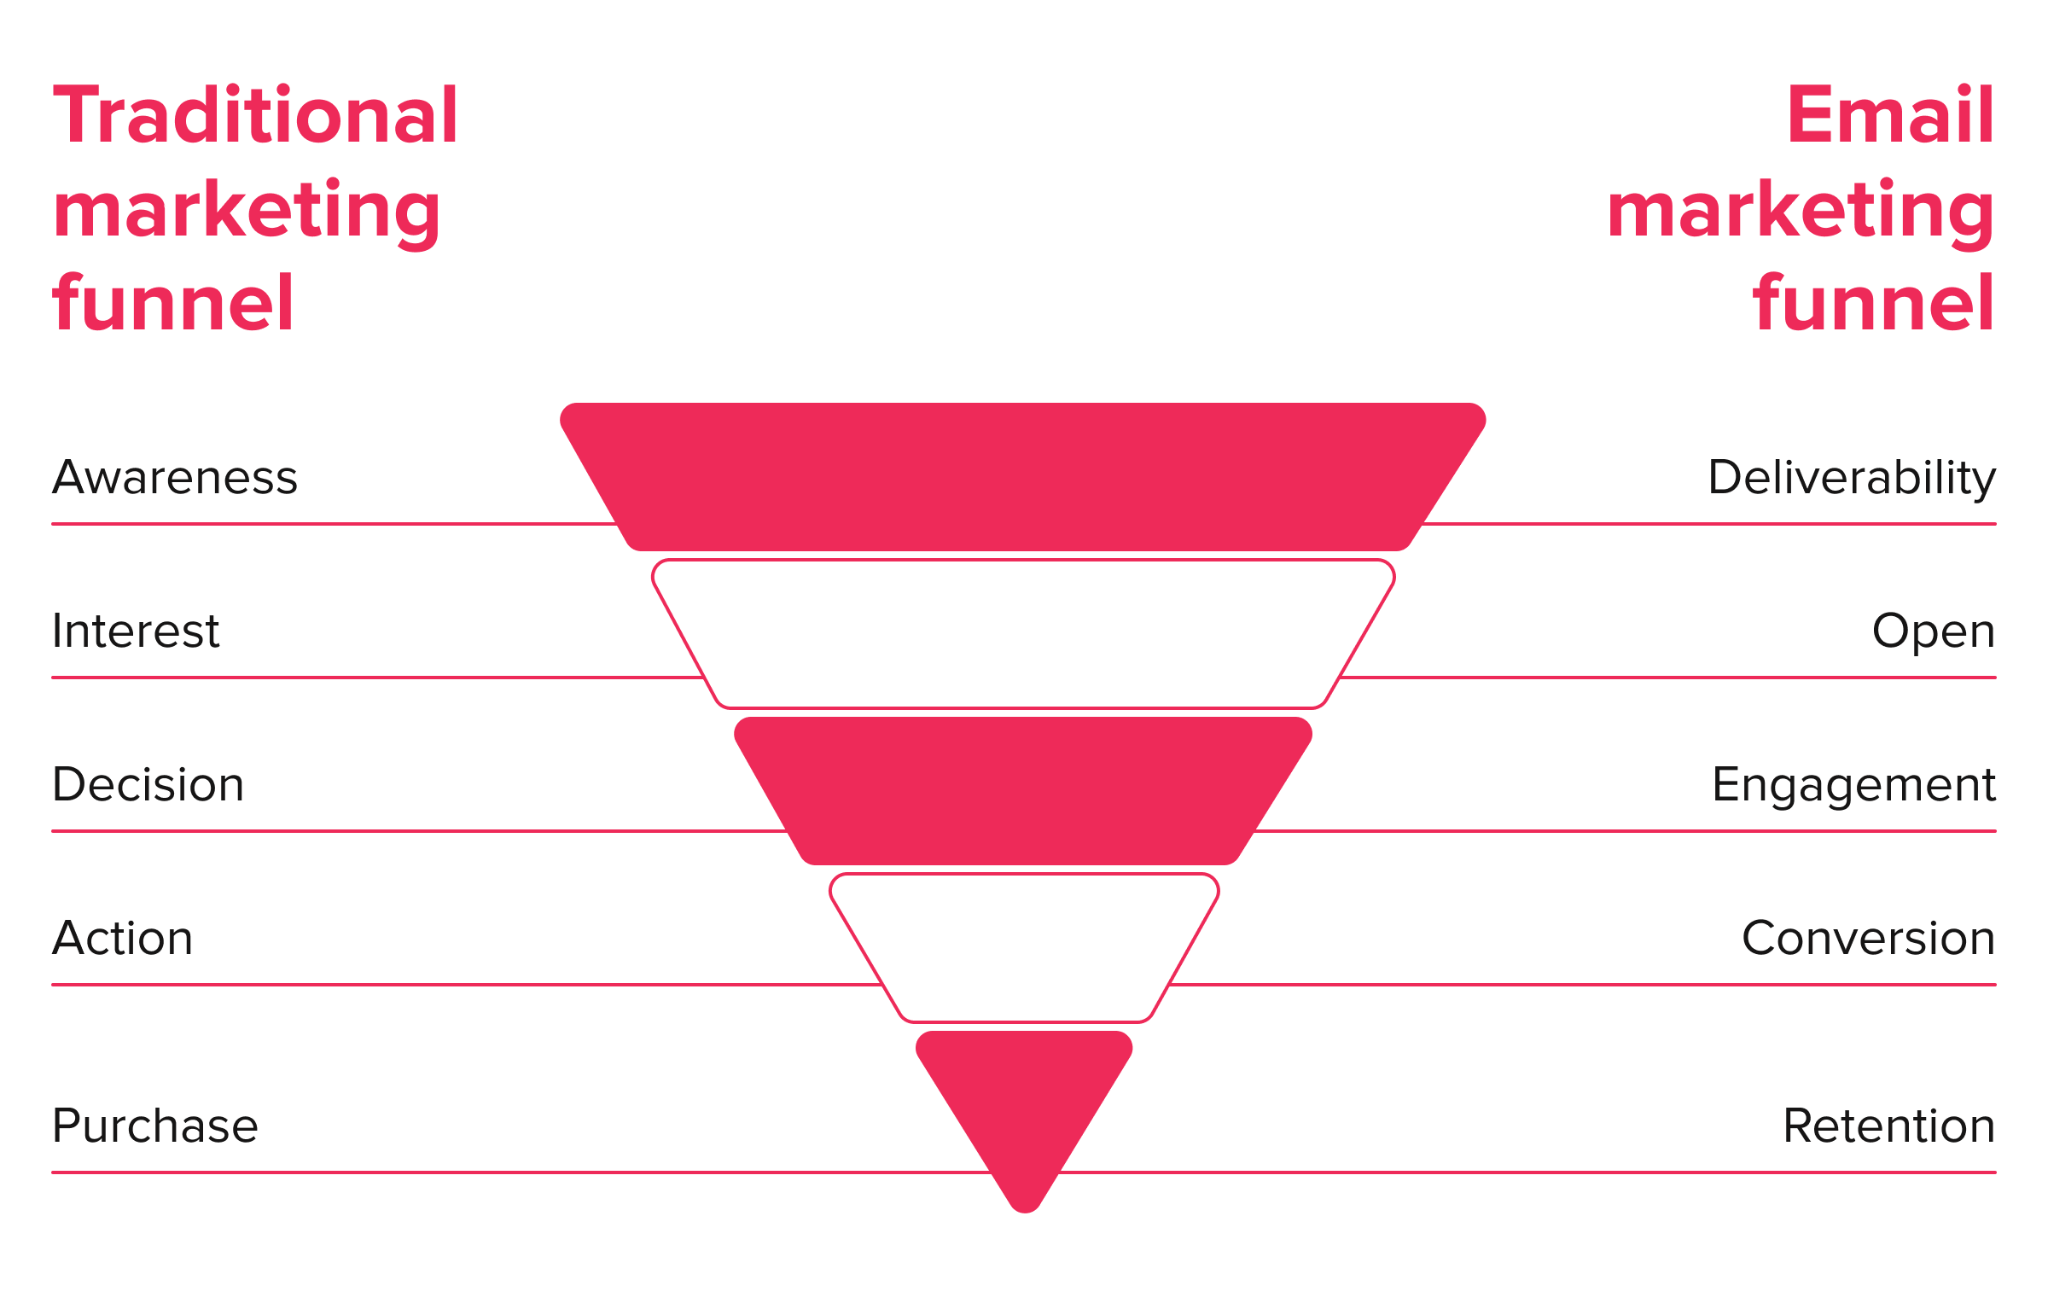
By aligning email marketing metrics with your business goals, you shift from “sending emails” to systematically generating revenue.
To effectively scale your channel, group your analysis by funnel stage: deliverability, engagement, conversions, list health, and revenue. Below is a reference table of the most important email marketing metrics every marketer or business owner should track.
| Metric | What It Measures | Benchmark |
| Delivery Rate | Emails that landed in inboxes | > 95% |
| Open Rate | Unique opens / delivered | 15–25% |
| CTR (Click-Through Rate) | Unique clicks / delivered | 2–5% |
| CTOR | Clicks / opens (content quality) | 10–30% |
| Conversion Rate | Completed goals (purchases/signups) | Varies by industry |
| Revenue per Email | Total revenue / number of emails | Varies by industry |
| Bounce Rate | Hard vs soft bounces | < 2% |
| Unsubscribe/Spam Rate | Audience churn & reputation | Unsub <0.5%; Spam <0.1% |
| List Growth Rate | Net new subscribers monthly | 2–5% per month |
| ROI | (Revenue – Cost) / Cost | 36:1 |
A delivery rate is the percentage of emails accepted by the recipient’s server (not rejected as a hard bounce).
Formula: (Emails Sent – Bounces) / Emails Sent * 100
A good benchmark is 95% or higher. A low delivery rate signals poor sender reputation, invalid addresses in your database, or blocklisting. You can’t optimize what isn’t delivered.
An open rate shows how many recipients actually opened your email.
Formula: Unique Opens / Delivered Emails * 100
The industry average ranges from 15–25%.
Important: Apple’s Mail Privacy Protection (MPP) routes tracking through proxy servers, artificially inflating opens. Use this metric for tracking dynamics and trends, not absolute values.
CTR measures the percentage of recipients who clicked at least one link in your email. This is a key email engagement metric.
Formula: Unique Clicks / Delivered Emails * 100
Industry benchmarks*:
*Sources: Mailchimp (2026), HubSpot (2025), Campaign Monitor (2026), Klaviyo (2025), Litmus (2026)
If CTR shows email effectiveness, CTOR shows content effectiveness. It measures relevance by ignoring those who didn’t open the email.
Formula: Unique Clicks / Unique Opens * 100
A good CTOR ranges from 10% to 30%. If CTR is low but CTOR is high, the subject line is the problem (i.e., those who open and click). If CTOR is low, the problem is with your CTA, content, or offer.
In the context of email marketing, this is the percentage of recipients who completed a desired action (purchase, webinar registration, content download). This is one of the important conversion metrics for email marketing.
Formula: Unique Conversions / Delivered Emails * 100
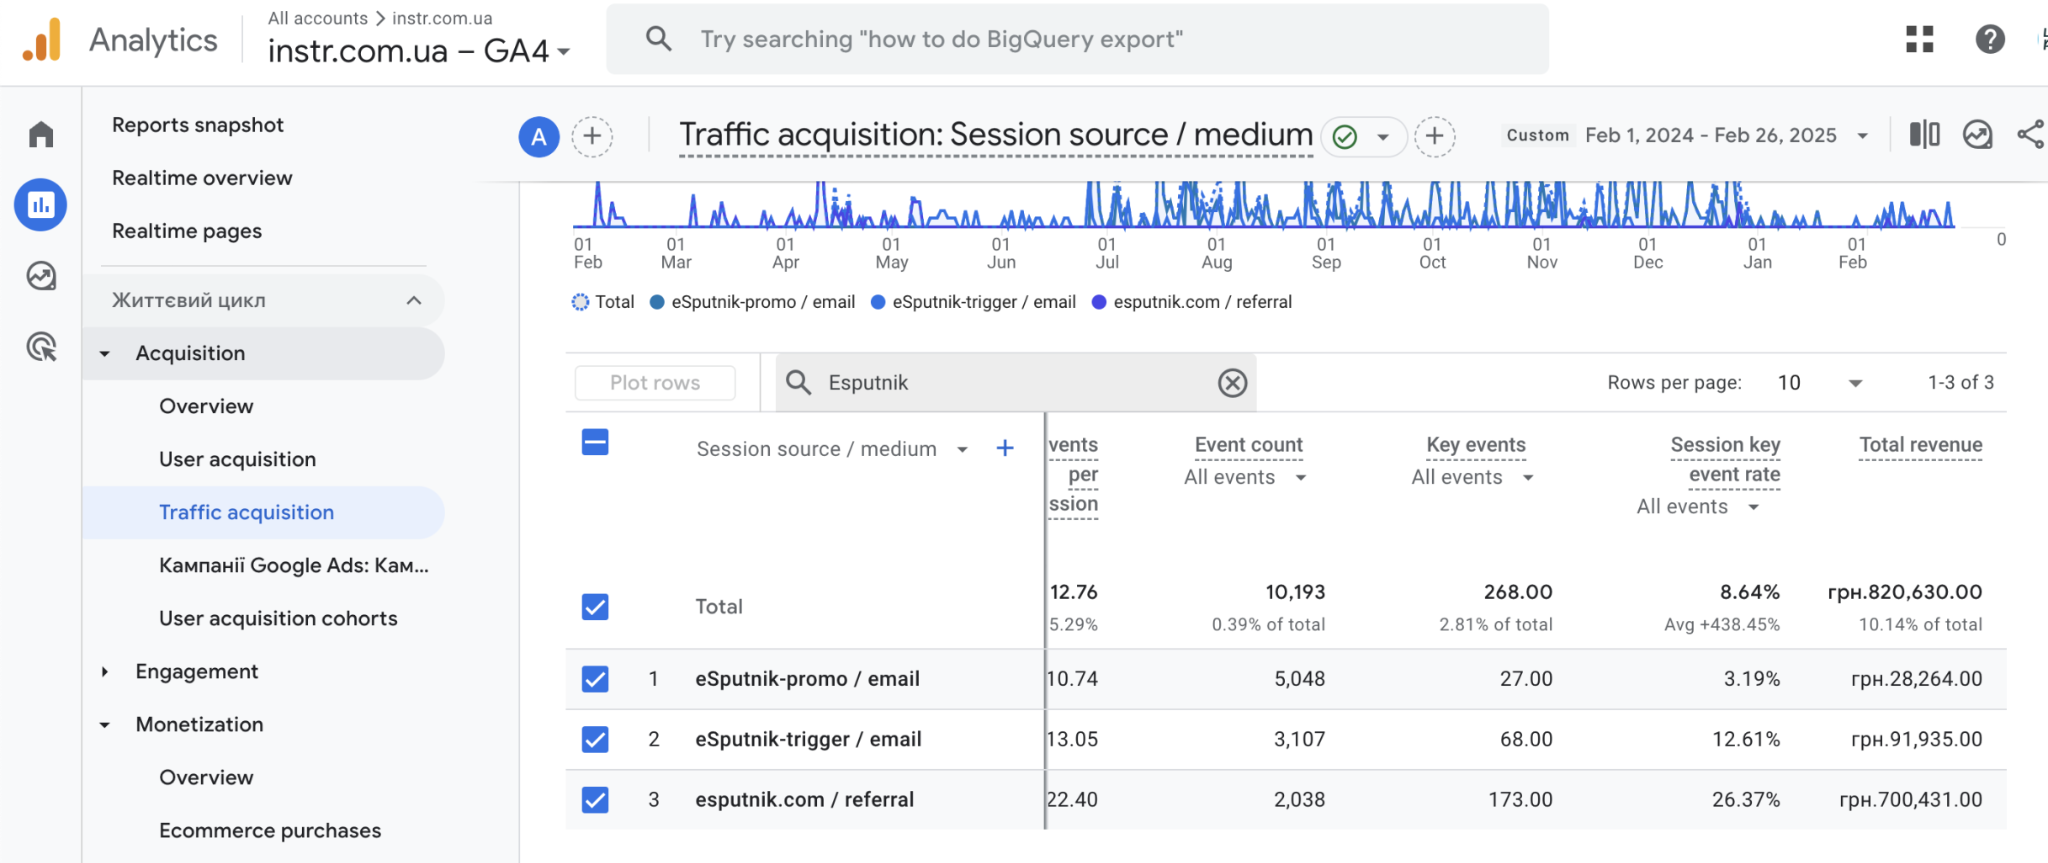
For accurate tracking, always add UTM parameters to your links (some ESPs add them automatically). Integrate your email platform with Google Analytics to attribute revenue directly to the campaign, not just to the last click. Our team at Livepage offers professional Google Analytics 4 setup and comprehensive digital analytics services — we’ll help you track all key events and integrate data from various sources.
This metric removes volume impact, showing the pure profitability of a single message.
Formula: Total Revenue from Campaign / Total Emails Sent
This is more actionable than overall ROI for campaign-level decisions. If one segment generates $0.50 per email and another generates $0.02, you know exactly where to allocate volume.
A bounce is an email returned by the server. It’s crucial to distinguish between the two types:
| Type | Meaning | Impact | Action |
| Hard Bounce | Invalid address (user doesn’t exist) | Permanent error | Remove from database immediately |
| Soft Bounce | Temporary issue (full inbox, server down) | Transient | Retry within 72 hours |
Formula: Total Bounces / Emails Sent * 100
The acceptable threshold is below 2%. A high hard bounce rate destroys your sender reputation with Gmail and Outlook.
These are “customer dissatisfaction” metrics.
High rates signal:
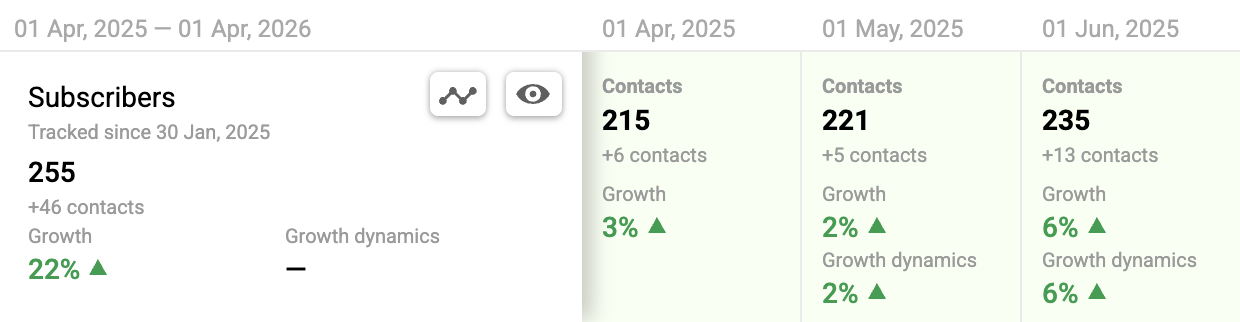
Measures how quickly you gain new subscribers net of churn.
Formula: (New Subscribers – Unsubscribes – Spam Complaints) / Total Subscribers * 100
A healthy list grows 2–5% monthly. However, list growth doesn’t always mean a healthy list. If you attract low-intent users (e.g., through free giveaways), your engagement metrics (CTR, CTOR) will drop, and spam complaints will rise.
The ultimate metric for business owners.
Formula: (Revenue from Email – Cost of Email Program) / Cost of Email Program * 100
Industry benchmark (according to the ANA Response Rate Report 2021): $36 to $42 for every $1 spent. To improve this, either increase revenue per email (by offering better deals) or reduce costs (by automating instead of manual sending).
Tracking email campaign performance metrics is only half the battle. Improvement requires specific, systematic actions based on the data you’ve collected. You can’t optimize what you don’t measure, but you also can’t grow by just looking at the numbers.
At Livepage, we operate on one principle: email marketing is not a static system but a continuous process of improvement. Every month, we analyze subject lines, formats, send times, and audience segments that yield the best results, and based on this data, we adjust our strategy.
Segmentation directly boosts opens, CTR, and conversions by ensuring relevance. Sending the same email to a prospect with a 30-day interaction history and a loyal customer with 3 years of history destroys value for both.
Practical segmentation ideas:
According to a joint study by eSputnik and Inweb (2026), conducted during peak demand (before February 14 and March 8) based on over 490 ecommerce businesses in Ukraine, triggered email campaigns showed a conversion rate of 2.07% — more than double that of bulk campaigns (0.84%). Even accounting for seasonal anomalies, the gap between campaign types is telling: personalized communication consistently converts better. Additionally, using product recommendations in bulk campaigns during this period increased average order value (AOV) by 1.4 times compared to regular orders. This proves that tracking conversion rates without segmenting by campaign type provides a distorted picture.
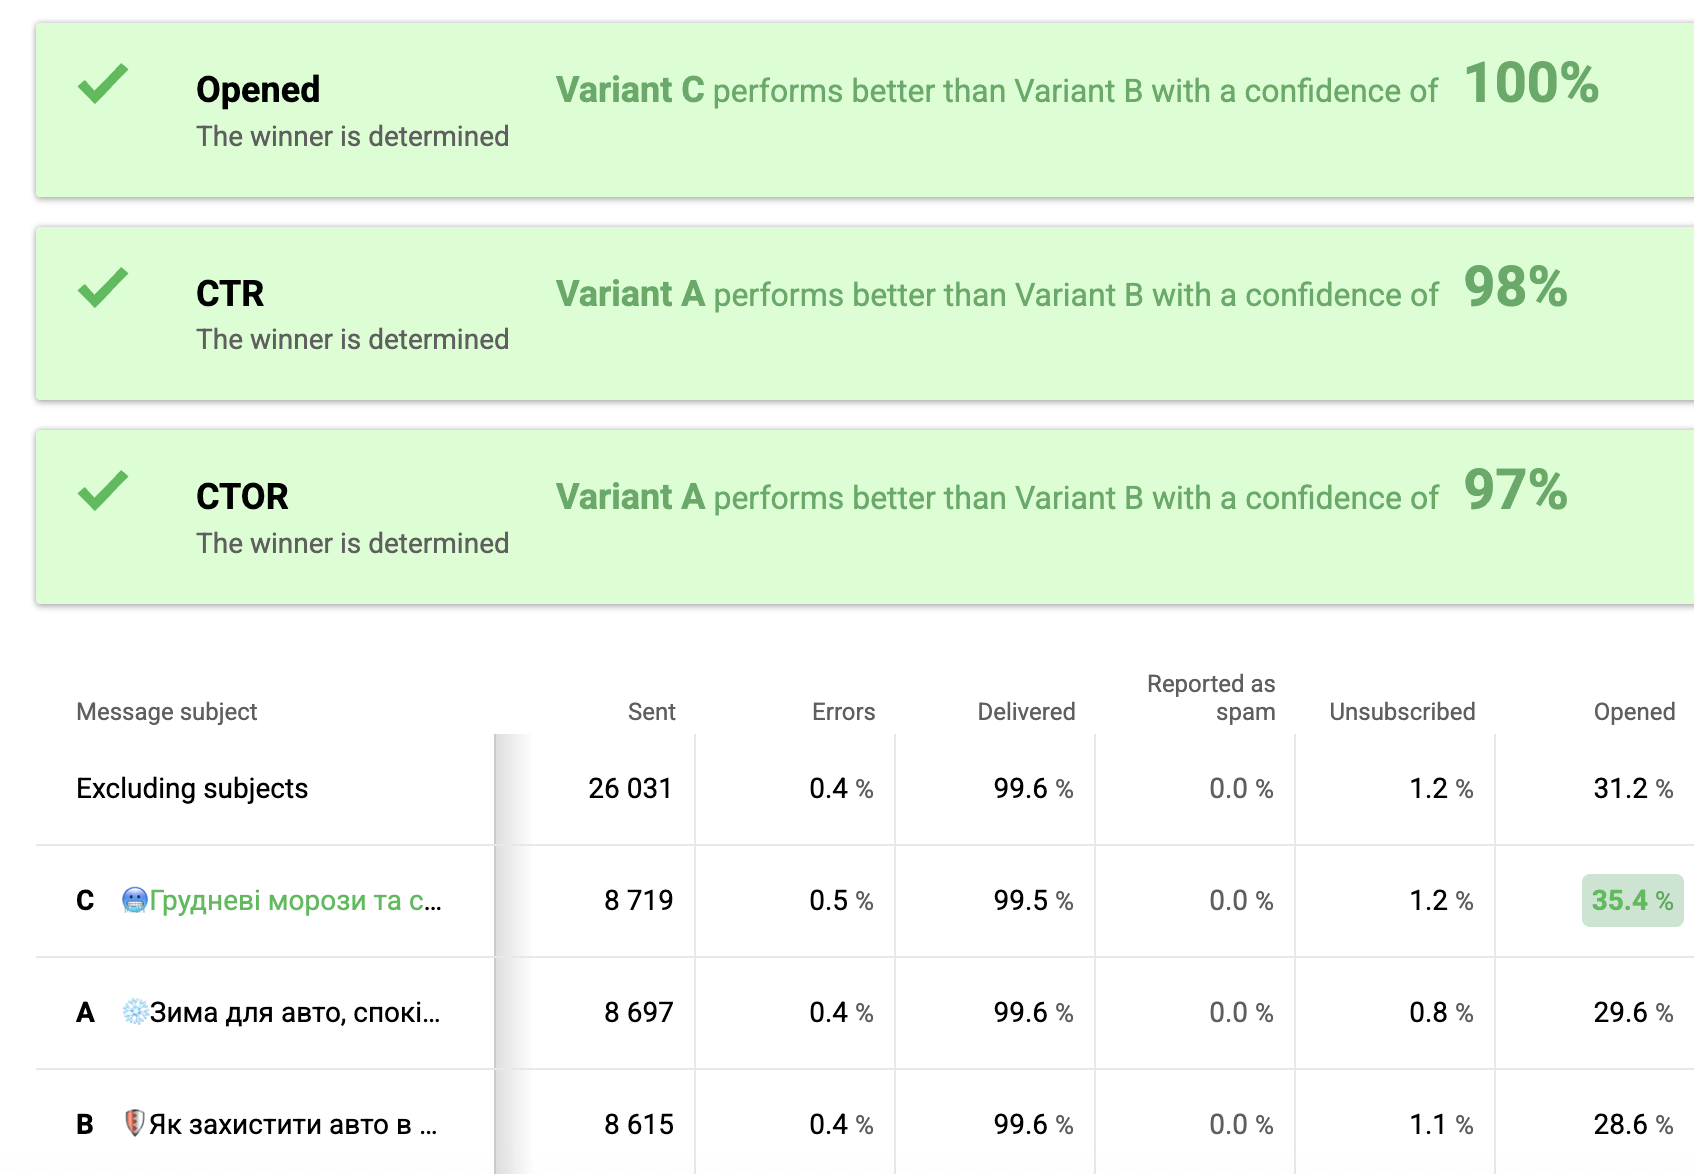
A/B testing is an experiment where you show different versions of a message (A, B, C) to random segments of your audience and measure which gets more clicks or conversions. Without testing, you risk losing sales due to “audience fatigue” — subscribers stop responding to repetitive messages.
What to test in email campaigns:
Pro tip: Test not minor changes (“Buy” vs. “Purchase”), but fundamentally different approaches — benefit, social proof, scarcity, and risk reduction.
How to read results. Wait for statistical significance before concluding. At typical e-commerce volumes, this can take 1–2 weeks per test. According to eSputnik, if you manage 10 scenarios and each test takes 2 weeks, one round of optimization will take almost 5 months, during which you lose hundreds of sales.
To move from reporting to growth, apply the SMART framework (Specific, Measurable, Achievable, Relevant, Time-bound) to your email marketing KPIs. Instead of “increase engagement,” clearly define success in numbers.
Examples of real KPI goals:
For tracking, use reliable ESP platforms: Klaviyo (for e-commerce), Mailchimp (for SMBs), or HubSpot (with built-in CRM).
Mastering email marketing performance metrics is all about strategic focus. Thus, moving from top-of-funnel metrics (opens) to bottom-of-funnel metrics (ROI, revenue per email) transforms email from a cost center into a profit driver.
Want an objective picture of your email effectiveness and to use data for growth? Order an email marketing audit from Livepage — we’ll analyze your campaigns across 10 key metrics, identify weak points in your funnel, and provide concrete recommendations to boost conversions.
Focus on delivery rate, open rate, and CTR. First, you need to ensure you’re landing in inboxes and that your content generates clicks. Don’t obsess over ROI until you have a stable sender reputation and at least 1,000 engaged subscribers.
Review real-time metrics (bounces, spam complaints) daily. Engagement metrics (CTR, CTOR) — weekly to optimize future sends. Strategic KPIs (list growth, ROI, LTV) — monthly or quarterly to adjust your overall marketing strategy.
Depending on what you want to achieve, you should prioritize:


“Livepage has proven to be a reliable source for rapid online growth. We started with 2,000 visitors per month. In 3 years together with Livepage we have reached 70,000 visitors and more than 100 leads from the site per month.”


“As for the results, we’ve been working together since 2015, and our traffic has increased 10x. I cannot say that Livepage was our first SEO company, but they have become the first SEO partner that helped us to achieve the success we were looking for.”

“Livepage delivers SEO efforts that have led to an increase in the site’s users, traffic, and conversions. The team uses a wide range of tools to achieve the client’s goals. They are attentive to the client’s needs, working with them in real-time and bringing in additional specialists when needed.”


“I am pleased with the quick task execution and the instant replies to my messages.”


“I like the complex approach that the Livepage team offers. Absolutely all team members work together; everyone is aware of what is happening on the project. We have one common goal – to increase our service sales, and the team is making every effort to achieve the goal as soon as possible.”


“We’ve been really impressed by how Livepage quickly understood our business and centred our PPC campaign around our objectives. We have achieved good results within a very short time in both revenue and ROI.”


“Everything is clear, timely, and understandable.”


“They have leveraged ideal opportunities to reach our business goals.”