




9 min reading
GA4 BigQuery Export: When You Really Need It



Mobile analytics is a system for collecting, analyzing, and interpreting data about how users behave in a mobile app on iOS or Android.
Mobile analytics combines tools, methods, and technologies that show how users interact with an app, which features attract the most attention, where friction appears, and what affects conversions, retention, and revenue.
At the same time, mobile app analytics goes beyond user behavior. It also helps measure the effectiveness of marketing campaigns, send events to advertising platforms for campaign optimization, and support data-driven decision-making. Without this layer of visibility, an app becomes something of a black box, where teams can see the outcome but struggle to explain what caused it.
Mobile application analytics is similar to web analytics in many ways, although mobile products require a more specialized approach. It typically covers:
That is why it is increasingly difficult to grow a digital product effectively without a systematic approach to data. From early-stage startups to platforms serving millions of users, app analytics helps teams understand what is happening inside the product and where the next growth opportunities may be.
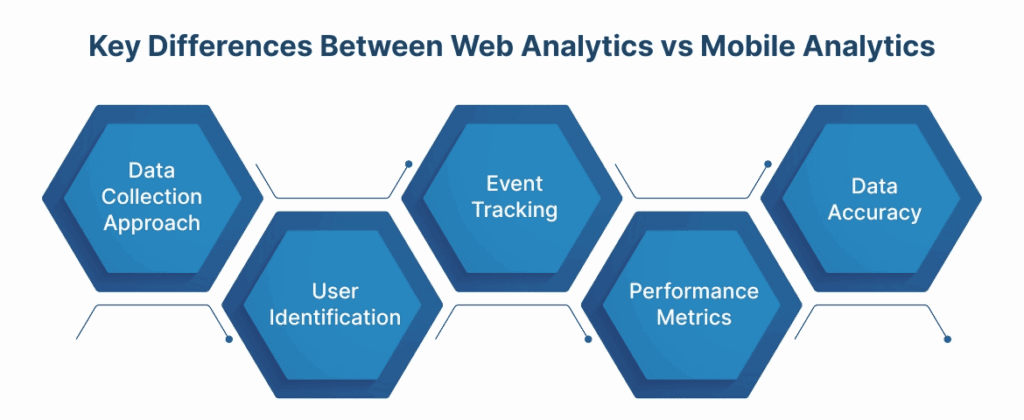
At first glance, mobile app data analytics may seem like regular analytics applied inside an app. In reality, the way data is collected, stored, and interpreted differs significantly from web analytics.
That is why understanding the difference between web analytics and mobile analytics is essential for anyone working with modern digital products.
Traditionally, web analytics has been built around the concept of a session:
Even modern tools such as GA4, despite their more user-focused model, still depend considerably on session-based and page-view-based logic when used for websites.
In mobile apps analytics, sessions are no longer the main unit of measurement. There are no traditional browser cookies, users may keep an app active without fully closing it for weeks, and engagement is measured through specific actions instead of page visits.
For this reason, mobile app analytics is usually organized around individual users and their lifecycle within the product. Sessions still exist, but they serve more of a technical purpose by grouping events that occur during a single period of activity.
For example, Firebase automatically records the session_start event, but most reports focus on users and events rather than sessions.
The transition from web analytics to analytics for apps often comes with several aspects that are easy to underestimate at first:
These mobile app analytics metrics help teams understand whether users come back, how well the app keeps them engaged, and whether the product creates lasting business value.
Modern mobile app analytics operates under much stricter data privacy requirements than it did just a few years ago. The biggest changes are related to:
This means that some information is no longer available in real time, much of marketing attribution is based on aggregated data, and analytics architecture should be considered before development starts rather than added later.
These restrictions cannot and should not be bypassed. However, their impact can be reduced significantly through a well-designed analytics architecture, a clear division of responsibilities between services, and modern approaches to data collection and analysis.
Working in a privacy-first mobile environment requires teams to rethink how they collect, interpret, and connect data across the user journey. Mobile app analytics best practices provide a framework for working effectively with first-party data, aggregated attribution, and cohort-based analysis.
In mobile app usage analytics, trying to manage every type of data in one platform is usually not the best approach. Marketing attribution and product analytics serve different purposes and are better handled separately.
For marketing attribution, companies often use a dedicated class of platforms called MMPs (Mobile Measurement Partners), such as AppsFlyer or Adjust. These tools handle attribution, SKAdNetwork, and integrations with advertising platforms. At the same time, mobile analytics tools such as Firebase, Mixpanel, or Amplitude are used for user behavior analytics, product performance evaluation, and understanding how people interact with the app.
By separating these responsibilities, teams are less dependent on aggregated attribution data and can build a more complete picture of the user journey, even when individual attribution data is limited.
Privacy restrictions have made third-party data far less accessible and reliable than it once was. As a result, mobile app analytics now depends much more heavily on first-party data. This includes in-app events (sign_up, trial_start, purchase, and subscription_renew), as well as internal user statuses and product parameters.
Because this data comes directly from the product, it is less vulnerable to external privacy limitations, becomes available more quickly, and gives teams a more accurate picture of how people use the app.
Another major shift has been the move away from expecting complete user-level attribution. Under current privacy restrictions, perfectly tracing every user is often unrealistic. Instead, teams increasingly analyze user cohorts based on factors such as campaigns, countries, platforms, app install dates, or monetization models.
Cohort analysis makes it possible to:
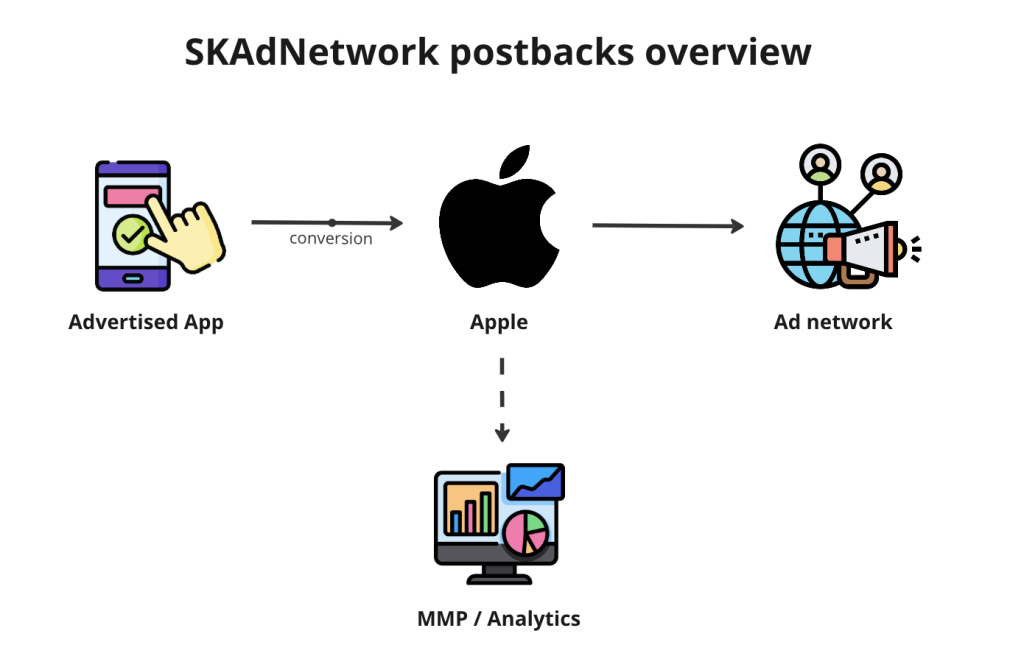
SKAdNetwork (SKAN) is Apple’s official framework for mobile advertising attribution on iOS.
It was created as a compromise between advertisers’ need to measure campaign performance and Apple’s privacy requirements. Thus, SKAdNetwork can show that an ad campaign led to an app install or a specific conversion, but it does not reveal the identity of the individual user.
The framework became a central part of iOS attribution after the introduction of App Tracking Transparency (ATT). Before ATT, Mobile Measurement Partners could use the Identifier for Advertisers (IDFA) to track much more of the user journey, from app installation to purchase.
With ATT, access to the IDFA requires explicit permission from the user. Because a large share of users decline tracking, the traditional model of user-level attribution has become far less available.
At a high level, the process looks like this:
The advertiser never receives direct information about the individual user. Instead, they receive aggregated attribution data with a delay.
When teams talk about working with SKAN, they usually mean working through an MMP such as AppsFlyer or Adjust.
An MMP typically:
Working directly with SKAN without this layer is considerably more difficult. It also places much more responsibility on developers, especially when it comes to setting up and maintaining the conversion schema.
Despite the limitations of the modern mobile ecosystem, most teams use a fairly similar analytics architecture.
Together, these tools allow teams to evaluate campaign performance, track in-app events, analyze funnels, segment users, and monitor important product metrics.
A common mistake is treating analytics as something that can be added shortly before launch. While that approach may still be recoverable on a website, it is much harder to fix in a mobile app.
Mobile business analytics has become part of the product itself rather than a separate technical layer. The events teams define during product planning determine what they will be able to measure after launch and which questions they can answer with data.
Before development begins, product teams, marketers, and analysts should agree on:
Planning this early takes more time, but it reduces the risk of missing important data, rebuilding tracking after release, or collecting information that turns out to have little business value.
So far, we have covered the basics of mobile analytics, the main differences between mobile and web analytics, and the ways stricter privacy requirements are changing how companies collect and use data.
Next, we will move on to the practical side and look at the platforms used for mobile app analytics, how they differ, and which solutions are best suited to different types of products. Spoiler: As is often the case, the real question is not “Which tool is better?” but “Which tool is the right fit for your product?”
Web analytics has had a fairly established group of market leaders for years. However, when exploring what is mobile app analytics, it is important to understand that the mobile landscape is more complex because different tools are built for different purposes, and no single platform covers every need equally well. That is why mobile analytics tools should be selected based on product needs, marketing strategy, and business goals rather than popularity alone.
Below, we will look at the main platforms used for mobile app analytics today, along with their advantages, limitations, and common use cases.
Product analytics platforms are designed to show what users do after they install the app and how they interact with the product over time. They help teams study behavior, find weak points in user journeys, and understand whether specific features are actually delivering value.
However, these platforms are not primarily built for marketing attribution, and they do not need to be. Their core role is to provide detailed app analytics rather than identify the advertising source behind each user.
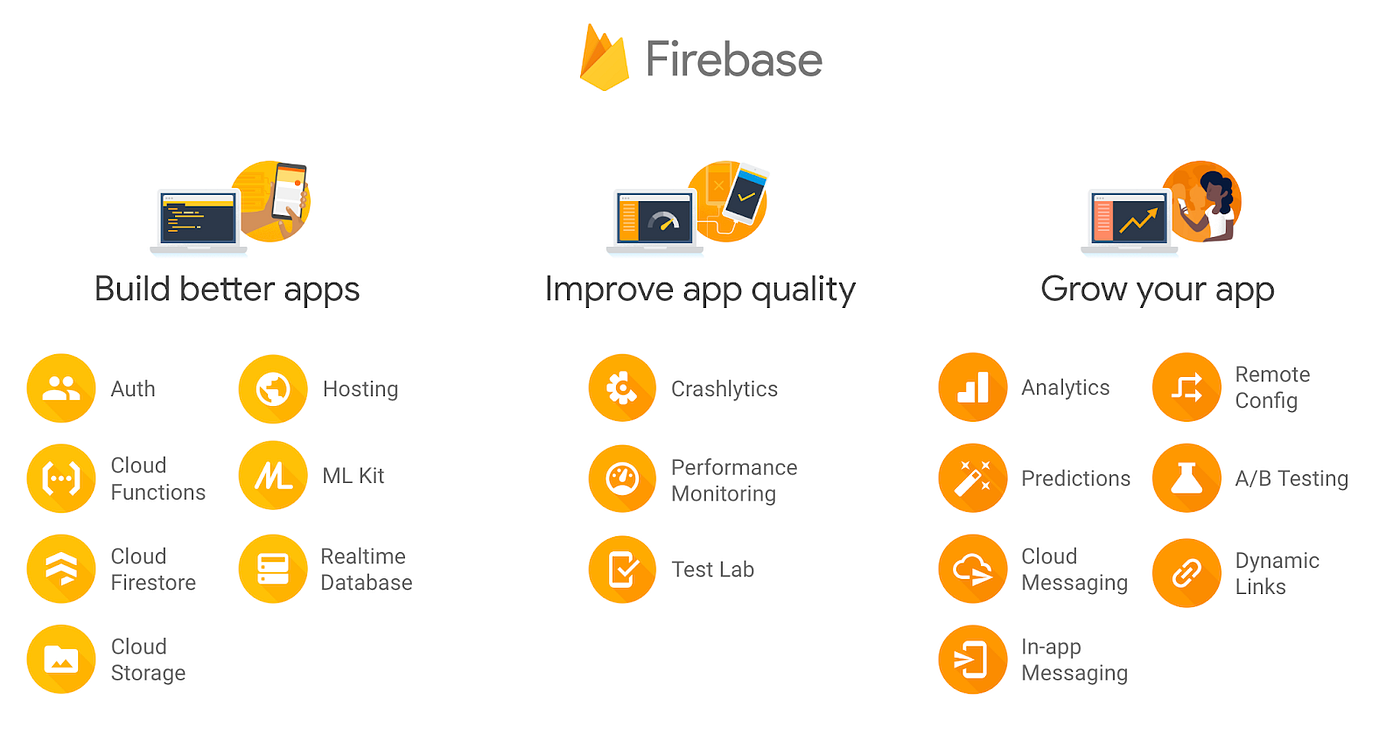
Firebase is essentially Google Analytics for mobile apps.
For many product teams, it is the starting point for mobile analytics. The platform provides a free set of core data collection capabilities, including automatic event tracking, audience building, conversion setup, and integration with Google’s advertising ecosystem. Teams familiar with GA4 usually find Firebase easy to understand because both platforms are built around events rather than traditional pageviews.
Firebase automatically tracks events such as first_open, session_start, and screen_view. Teams can also define custom events, create audiences, and send conversion data directly to Google Ads.
One of the platform’s biggest advantages is its integration with BigQuery. Exporting data to BigQuery provides access to raw data, making it possible to create highly customized reports, connect BI systems, and build custom analytical models.
Important! Firebase does not require ATT permission for product analytics. Even when a user declines advertising tracking, teams can still collect events, analyze funnels, and measure retention. The main restrictions apply to advertising attribution rather than analysis of in-app behavior.
Advantages:
Disadvantages:
Mixpanel is a dedicated product analytics platform built specifically for analyzing user behavior.
While Firebase helps teams get started quickly, Mixpanel makes it possible to explore much more deeply how people interact with a product. This is where behavioral analytics becomes especially valuable.
The platform is particularly useful for:
One of Mixpanel’s biggest advantages is that product teams can answer many important questions without writing SQL queries. Product Managers, Product Owners, and Growth teams can explore data directly and get insights without relying on analysts for every query.
Mixpanel can also be attractive for smaller apps thanks to its free plan, which supports up to one million events per month.
Advantages:
Disadvantages:
Amplitude is often described as an enterprise alternative to Mixpanel. The two platforms follow a similar logic, but Amplitude is primarily designed for larger products and data-driven organizations.
The platform is especially strong when teams need to analyze long-term user behavior.
Key capabilities include:
Amplitude is widely used by SaaS companies, subscription businesses, and large mobile platforms where analyzing individual events is not enough. These teams often need to understand behavioral patterns that develop over weeks, months, or even longer periods.
Pricing depends on event volume. The free plan supports up to 10 million events per month. Paid plans apply beyond that, with up to 25 million monthly events priced at $49 per month, while larger companies can choose enterprise plans with custom terms.
Advantages:
Disadvantages:
| Platform | Product | Marketing | Attribution | Price |
| Firebase | ⭐⭐⭐⭐ | ⭐⭐⭐ | ❌ | Free |
| Mixpanel | ⭐⭐⭐⭐⭐ | ⭐⭐ | ❌ | $$ |
| Amplitude | ⭐⭐⭐⭐⭐ | ⭐⭐ | ❌ | $ |
How to read this table:
Unlike product analytics platforms, MMPs are not designed to analyze how users behave inside the app. Their main role is to determine where users came from, which advertising channel or campaign led to the install, and how effectively that marketing investment performed afterward.
This makes MMPs responsible for the marketing side of mobile analytics, while tools such as Firebase, Mixpanel, and Amplitude focus on product behavior. In most modern mobile products, these systems work together and complement one another.
AppsFlyer is one of the most widely used Mobile Measurement Partners (MMPs) on the market. Its core function is attribution, helping teams identify which ad campaign or acquisition channel generated an install and measure the performance of marketing investments over time.
The platform integrates with most major advertising networks, including Google Ads, Meta, TikTok, and Apple Search Ads. AppsFlyer is also built to work with SKAdNetwork, supports deep linking, and includes advanced protection against ad fraud.
However, AppsFlyer is not intended to replace a product analytics tool. Its main purpose is marketing attribution and campaign performance measurement.
Advantages:
Disadvantages:
Adjust is a direct competitor to AppsFlyer. The two platforms offer very similar functionality, so the choice between them often comes down to budget, existing integrations, and specific business requirements.
The platform focuses primarily on attribution and marketing measurement. It supports SKAdNetwork, includes fraud prevention tools, and helps teams analyze the performance of paid acquisition campaigns. Adjust also provides product analytics features, although these are not as advanced as its attribution and marketing capabilities.
Advantages:
Disadvantages:
Branch is often considered both an MMP and one of the leading solutions for deep linking.
Its main advantage is the ability to track the full user journey across a website, mobile app, and later interactions with the product.
In addition to marketing attribution, Branch supports deep linking and deferred deep linking, tracks events after users arrive from external channels, works with SKAdNetwork, builds web → app → app action journeys, and supports user re-engagement.
Branch is also relatively expensive, with its entry-level package starting at $199 per month.
Advantages:
Disadvantages:
| Platform | Attribution | Marketing | Deep linking | Privacy / SKAN | Price |
| AppsFlyer | ⭐⭐⭐⭐⭐ | ⭐⭐⭐⭐⭐ | ⭐⭐⭐ | ⭐⭐⭐⭐⭐ | $$$ |
| Adjust | ⭐⭐⭐⭐⭐ | ⭐⭐⭐⭐⭐ | ⭐⭐⭐ | ⭐⭐⭐⭐⭐ | $$$ |
| Branch | ⭐⭐⭐⭐ | ⭐⭐⭐⭐ | ⭐⭐⭐⭐⭐ | ⭐⭐⭐⭐ | $$–$$$ |
How to read this table:
Quick interpretation:
After reviewing product analytics platforms, MMPs, ATT, and SKAdNetwork, a natural follow-up question is, “How do all of these components work together in a real project?”
Most mobile analytics setups do not rely on one platform alone. Usually, teams use a combination of platforms, with each one responsible for a specific part of the analytics ecosystem.
A typical setup might look like this:
Mobile App
├─ Firebase (product analytics)
├─ AppsFlyer / Adjust (attribution)
├─ Google Ads / Meta Ads
└─ BigQuery / BI
In this setup, the mobile app serves as the main data source. Information is then sent to different systems depending on its purpose.
Firebase handles product analytics. It collects data about how users interact with the app and helps teams analyze onboarding, in-app events, behavioral patterns, and funnels.
AppsFlyer or Adjust handles marketing attribution. These platforms identify install sources, measure campaign performance, and work with SKAdNetwork.
Google Ads, Meta Ads, and other advertising platforms use the signals they receive to optimize campaigns automatically.
At the top level of the architecture, teams often use BigQuery or another BI solution to combine and store data and build more advanced analytical reports.
No single platform can solve every analytics task. In most cases, modern mobile analytics is an ecosystem of connected tools rather than one universal solution.
From the outside, analytics implementation may seem as simple as installing an SDK and letting the system automatically collect everything you need. In reality, a reliable setup involves several connected stages. A mistake at any one of them can significantly affect the accuracy of future analytics.
Every implementation should begin with planning rather than coding.
At this stage, the team defines:
The result is an Event Map, which serves as the blueprint for the app’s analytics setup. It is also where teams define the mobile analytics metrics they will use and establish how those metrics should be calculated.
Once the tracking logic is ready, the technical implementation begins:
The quality of this integration directly affects the reliability of the data collected later.
After the integration is complete, the entire analytics setup should be tested to make sure everything works correctly.
This usually involves:
Testing is where many common issues are discovered, including:
Fixing these issues before launch helps protect the quality of historical data and prevents reporting problems later.
The next stage is to send important conversion events to Google Ads, Meta Ads, and other ad platforms.
There is no need to send every event the app generates. It is much more effective to focus on signals that reflect real business value, such as registration, subscription activation, purchase, or another key conversion. This gives advertising algorithms stronger signals and helps them optimize campaigns more effectively.
Depending on the complexity of the app, mobile analytics implementation usually takes:
Even when the analytics architecture is designed correctly and the implementation is technically sound, several limitations can still affect how teams collect and interpret data.
Understanding what is mobile analytics today means looking beyond basic reporting. It has become a foundation for product, marketing, and business decision-making. A well-designed mobile analytics setup helps teams understand user behavior, measure advertising performance, identify weak points in user journeys, and make decisions based on data rather than assumptions.
At the same time, there is no universal solution. Effective mobile app analytics usually combines several platforms: product analytics tools (Firebase, Mixpanel, or Amplitude), an MMP for marketing attribution, and BI solutions for centralized data analysis.
If you are planning to launch a mobile app or improve an existing data collection system, it is worth designing the analytics architecture before development begins. This helps prevent data loss, reduce the cost of future changes, and get answers to important business questions faster.
The Livepage team can support both new analytics implementations and improvements to existing setups. We help design mobile analytics architecture, configure event tracking, connect the required platforms, and create a reliable data system that supports product growth.
Contact us for a consultation and to find an analytics solution that fits your business goals.


“Livepage has proven to be a reliable source for rapid online growth. We started with 2,000 visitors per month. In 3 years together with Livepage we have reached 70,000 visitors and more than 100 leads from the site per month.”


“As for the results, we’ve been working together since 2015, and our traffic has increased 10x. I cannot say that Livepage was our first SEO company, but they have become the first SEO partner that helped us to achieve the success we were looking for.”


“Livepage delivers SEO efforts that have led to an increase in the site’s users, traffic, and conversions. The team uses a wide range of tools to achieve the client’s goals. They are attentive to the client’s needs, working with them in real-time and bringing in additional specialists when needed.”


“I am pleased with the quick task execution and the instant replies to my messages.”


“I like the complex approach that the Livepage team offers. Absolutely all team members work together; everyone is aware of what is happening on the project. We have one common goal – to increase our service sales, and the team is making every effort to achieve the goal as soon as possible.”


“We’ve been really impressed by how Livepage quickly understood our business and centred our PPC campaign around our objectives. We have achieved good results within a very short time in both revenue and ROI.”


“Everything is clear, timely, and understandable.”


“They have leveraged ideal opportunities to reach our business goals.”