



9 min reading
What Role Does Content Marketing Play in Building Brand Loyalty



You’ve launched a website, installed Google Analytics 4, configured events, and gained access to a large amount of analytics data. In standard GA4 reports, you can see where users come from, which pages they view, how many conversions they complete, and which advertising campaigns deliver results.
As time goes on, however, the questions become more complex. How much revenue did customers generate within 30 days after their first purchase? Which sequences of events most often end in a conversion? How do users who were first acquired through advertising behave? Which channels bring in not just buyers but customers with high long-term value?
At this stage, the standard interface may no longer be enough. GA4 reports are good at answering typical marketing questions, but more complex scenarios require access to more detailed data and the ability to define the analysis logic yourself.
That’s where the Google Analytics 4 BigQuery integration comes in — connecting GA4 with the BigQuery cloud data warehouse for more flexible analysis.
GA4 is well suited for day-to-day monitoring: it makes it convenient to track users, sessions, traffic sources, events, conversions, and revenue. Most basic metrics are already prepared, so you do not need to process the data yourself to view them.
But this convenience has a downside. The GA4 interface operates within a predefined structure, which means that analysts depend on the available dimensions, metrics, attribution rules, and reporting logic.
For tracking overall traffic trends or comparing channel performance, that is usually enough. The challenges begin when you need to follow the behavior of specific user groups over time, reconstruct the full sequence of their actions, or combine web data with information about orders, customers, and actual revenue.
Some of these tasks can be handled in Explorations in GA4, which includes segments, funnels, cohorts, and path analysis. But as an analysis involves more conditions, events, time periods, and relationships between them, it becomes increasingly difficult to fit within the interface. Eventually, instead of defining the analysis based on business needs, you end up adjusting the questions to match what GA4 allows you to build.
Another issue can be the GA4 reporting limitations. Certain reports and explorations may be affected by data thresholding in GA4, which can hide some results, or by sampling when data volumes are large. In other words, GA4 data sampling can affect the level of detail in the results. Data thresholds and high cardinality are also important to consider because they can cause some data to be hidden, grouped, or shown at a lower level of detail.
BigQuery takes a different approach. When GA4 data is exported to BigQuery, a company gains access to GA4 raw data for individual events and can define calculation logic, build segments, reconstruct sequences of actions, and combine analytics data with other sources.
That is why, before setting up a GA4 export to BigQuery, it is important to determine what data the business needs and what it will be used for.
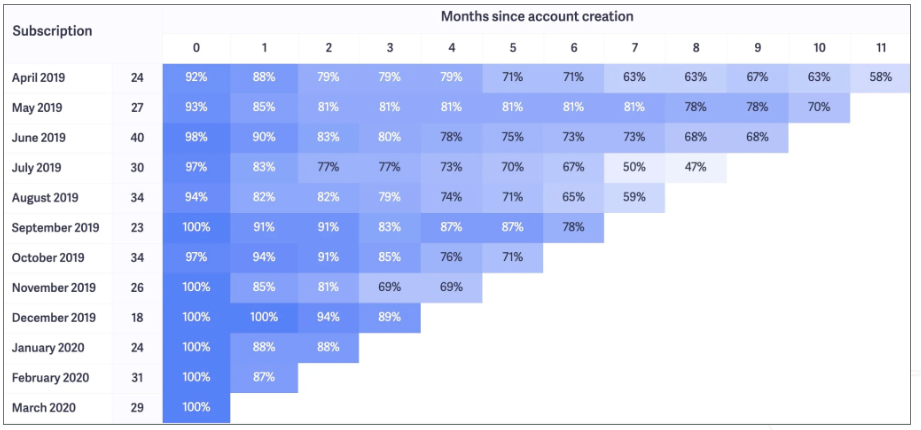
Cohort analysis groups users based on a shared characteristic. For example, cohorts can be created based on the week of the first visit, registration date, first purchase, or acquisition source. You can then track how the behavior of each group changes:
GA4 has basic capabilities for cohort analysis, including in the Explorations section. However, they are limited by the available metrics and dimensions and also use device-based user identification, which can result in the same customer being duplicated across different devices.
In BigQuery, analysts can define for themselves what should be considered the beginning of a user’s lifecycle, how cohorts should be formed, and which action should count as a return. This is especially important for businesses with a long decision-making cycle, repeat purchases, or a subscription model.
For example, two advertising campaigns may generate the same number of initial purchases. But users from the first campaign never return, while customers from the second make several more orders over the next three months. In a standard report, the two campaigns may look equally effective, while cohort analysis reveals the difference.
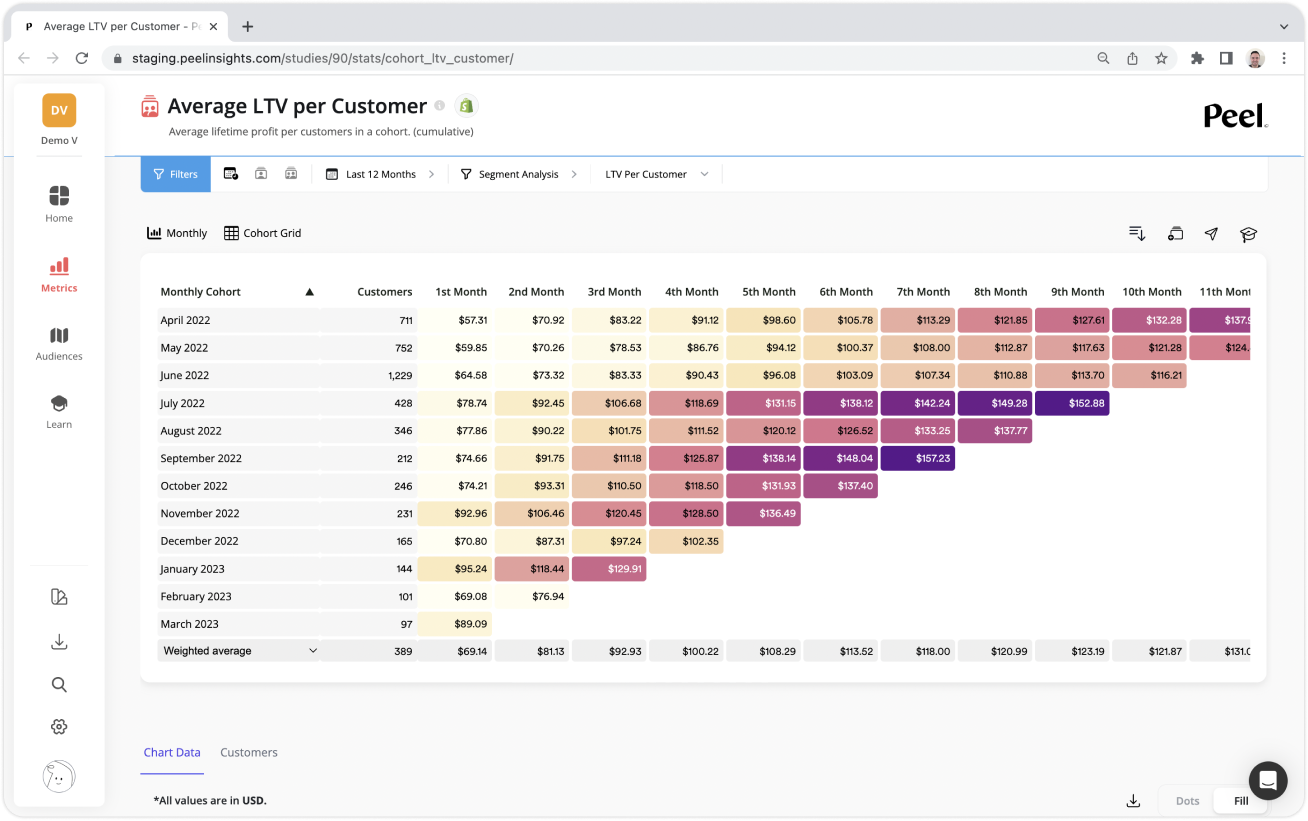
One of the main drawbacks of superficial advertising analysis is evaluating campaigns based only on the first conversion. A user may make a small first purchase and then return regularly. Another customer may place a large order right away and never interact with the company again. To understand the true value of these customers, businesses use LTV — the total value a user generates over a specific period.
BigQuery allows you to combine all purchases made by the same user, calculate cumulative revenue, and compare LTV across different attributes:
This type of GA4 data analysis changes the approach to marketing. A campaign with a high cost for the first purchase may turn out to be profitable if it attracts customers with high LTV. Conversely, a campaign with a low conversion cost is not always profitable if its users do not return.
A standard funnel often looks simple:
Product view → Add to cart → Purchase
In reality, user behavior is almost never that linear.
Thus, before making a purchase, a person may:
You can create funnels in GA4, but complex scenarios quickly run into the limitations of the interface. This is especially true when you need to account for time intervals, repeated events, different user types, or alternative paths.
In BigQuery, you can define each step using your own conditions. For example, you can identify users who viewed at least three products, used site search, and added a product to their cart but did not purchase it within seven days. Or you can compare the conversion rate of users who read the blog before making a purchase with those who went directly to a product page. SQL queries on GA4 data let you define exactly which conditions place a user into a specific scenario.
These funnels do more than reveal where the biggest drop-off happens. They help you understand why it happens.
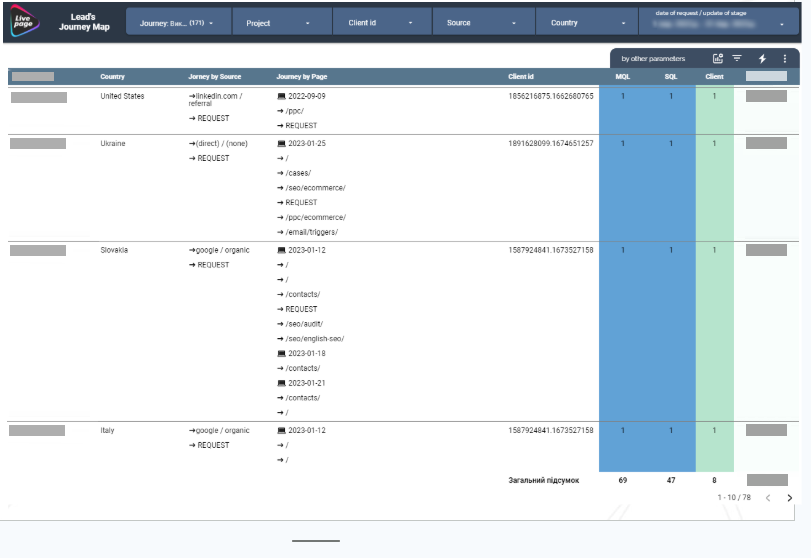
GA4 primarily aggregates data. You can see the number of views, events, sessions, and conversions, but it is easy to lose the actual sequence of actions behind these numbers. BigQuery allows us to reconstruct the user journey in chronological order — from the first visit to a purchase or another target action.
Working with GA4 event data in BigQuery gives analysts the event-level detail needed to understand how those interactions connect across the full customer journey.
This type of analysis can show that users:
This analysis helps you see the product from the user’s perspective. Based on these findings, you can change the site structure, simplify checkout, improve navigation, and build more precise advertising audiences.
It is important to understand that BigQuery does not make standard GA4 reports unnecessary. GA4 remains a convenient tool for day-to-day monitoring. You can quickly check traffic trends, conversion numbers, key acquisition sources, or the performance of a specific campaign.
A GA4 BigQuery export becomes necessary when a business question can no longer be answered with a single standard report.
In practice, these tools usually work together:
BigQuery also allows you to combine GA4 data with other sources: CRM systems, advertising platforms, order management systems, product return data, margin data, or lead statuses. This makes it possible to create a GA4-CRM data join and get a more complete picture of the customer’s interaction with the business.
This brings analytics closer to the business itself. Instead of getting a report on website events, the company gets a complete picture, from the first advertising touchpoint to actual revenue.
BigQuery becomes necessary not when a company simply has a large amount of data, but when standard reports stop answering important business questions. If a business needs to analyze repeat purchases, LTV, complex funnels, cohorts, and full user journeys or combine GA4 data with CRM data, the analytics interface alone is no longer sufficient. At that point, it can make sense to enable the BigQuery export in GA4 so the data can be analyzed at a deeper level.
However, when evaluating a GA4 BigQuery export cost, it’s important to consider both GA4 export limits and BigQuery’s own storage and query costs. Standard GA4 properties are limited to 1 million events per day for daily exports. BigQuery’s free tier makes it possible to get started without significant costs. BigQuery Sandbox is available for testing.
It is also essential to think about GA4 data retention in advance. In Explorations GA4 data retention is up to 14 months, which can become a constraint for businesses that need to analyze longer customer lifecycles or historical trends. Exporting data to BigQuery lets you keep it for longer and build your own historical dataset for future analysis.
GA4 is good at showing what happened. BigQuery helps explain how it happened, which users were involved, in what sequence, and what business outcome it ultimately produced. At that point, data goes beyond describing the past and starts helping you make better decisions.
At Livepage, we work with reports ranging from simple to highly complex and can support whatever level of analytical depth your ideas require. Whatever your analytics goals, we can help build a solution that turns your data into clear, actionable insights.


“Livepage has proven to be a reliable source for rapid online growth. We started with 2,000 visitors per month. In 3 years together with Livepage we have reached 70,000 visitors and more than 100 leads from the site per month.”


“As for the results, we’ve been working together since 2015, and our traffic has increased 10x. I cannot say that Livepage was our first SEO company, but they have become the first SEO partner that helped us to achieve the success we were looking for.”


“Livepage delivers SEO efforts that have led to an increase in the site’s users, traffic, and conversions. The team uses a wide range of tools to achieve the client’s goals. They are attentive to the client’s needs, working with them in real-time and bringing in additional specialists when needed.”


“I am pleased with the quick task execution and the instant replies to my messages.”


“I like the complex approach that the Livepage team offers. Absolutely all team members work together; everyone is aware of what is happening on the project. We have one common goal – to increase our service sales, and the team is making every effort to achieve the goal as soon as possible.”


“We’ve been really impressed by how Livepage quickly understood our business and centred our PPC campaign around our objectives. We have achieved good results within a very short time in both revenue and ROI.”


“Everything is clear, timely, and understandable.”


“They have leveraged ideal opportunities to reach our business goals.”